5.4. Port Statistics
This section describes the XenaManager port statistics page. The page displays statistics information for the currently selected port and all streams defined on that port.
The page will only display data for a single port at a time. If you want to monitor statistics data for multiple ports at a time please refer to Stream Configuration Grid.
5.4.1. Port TX Statistics
This area contains statistics for all data transmitted by the port.
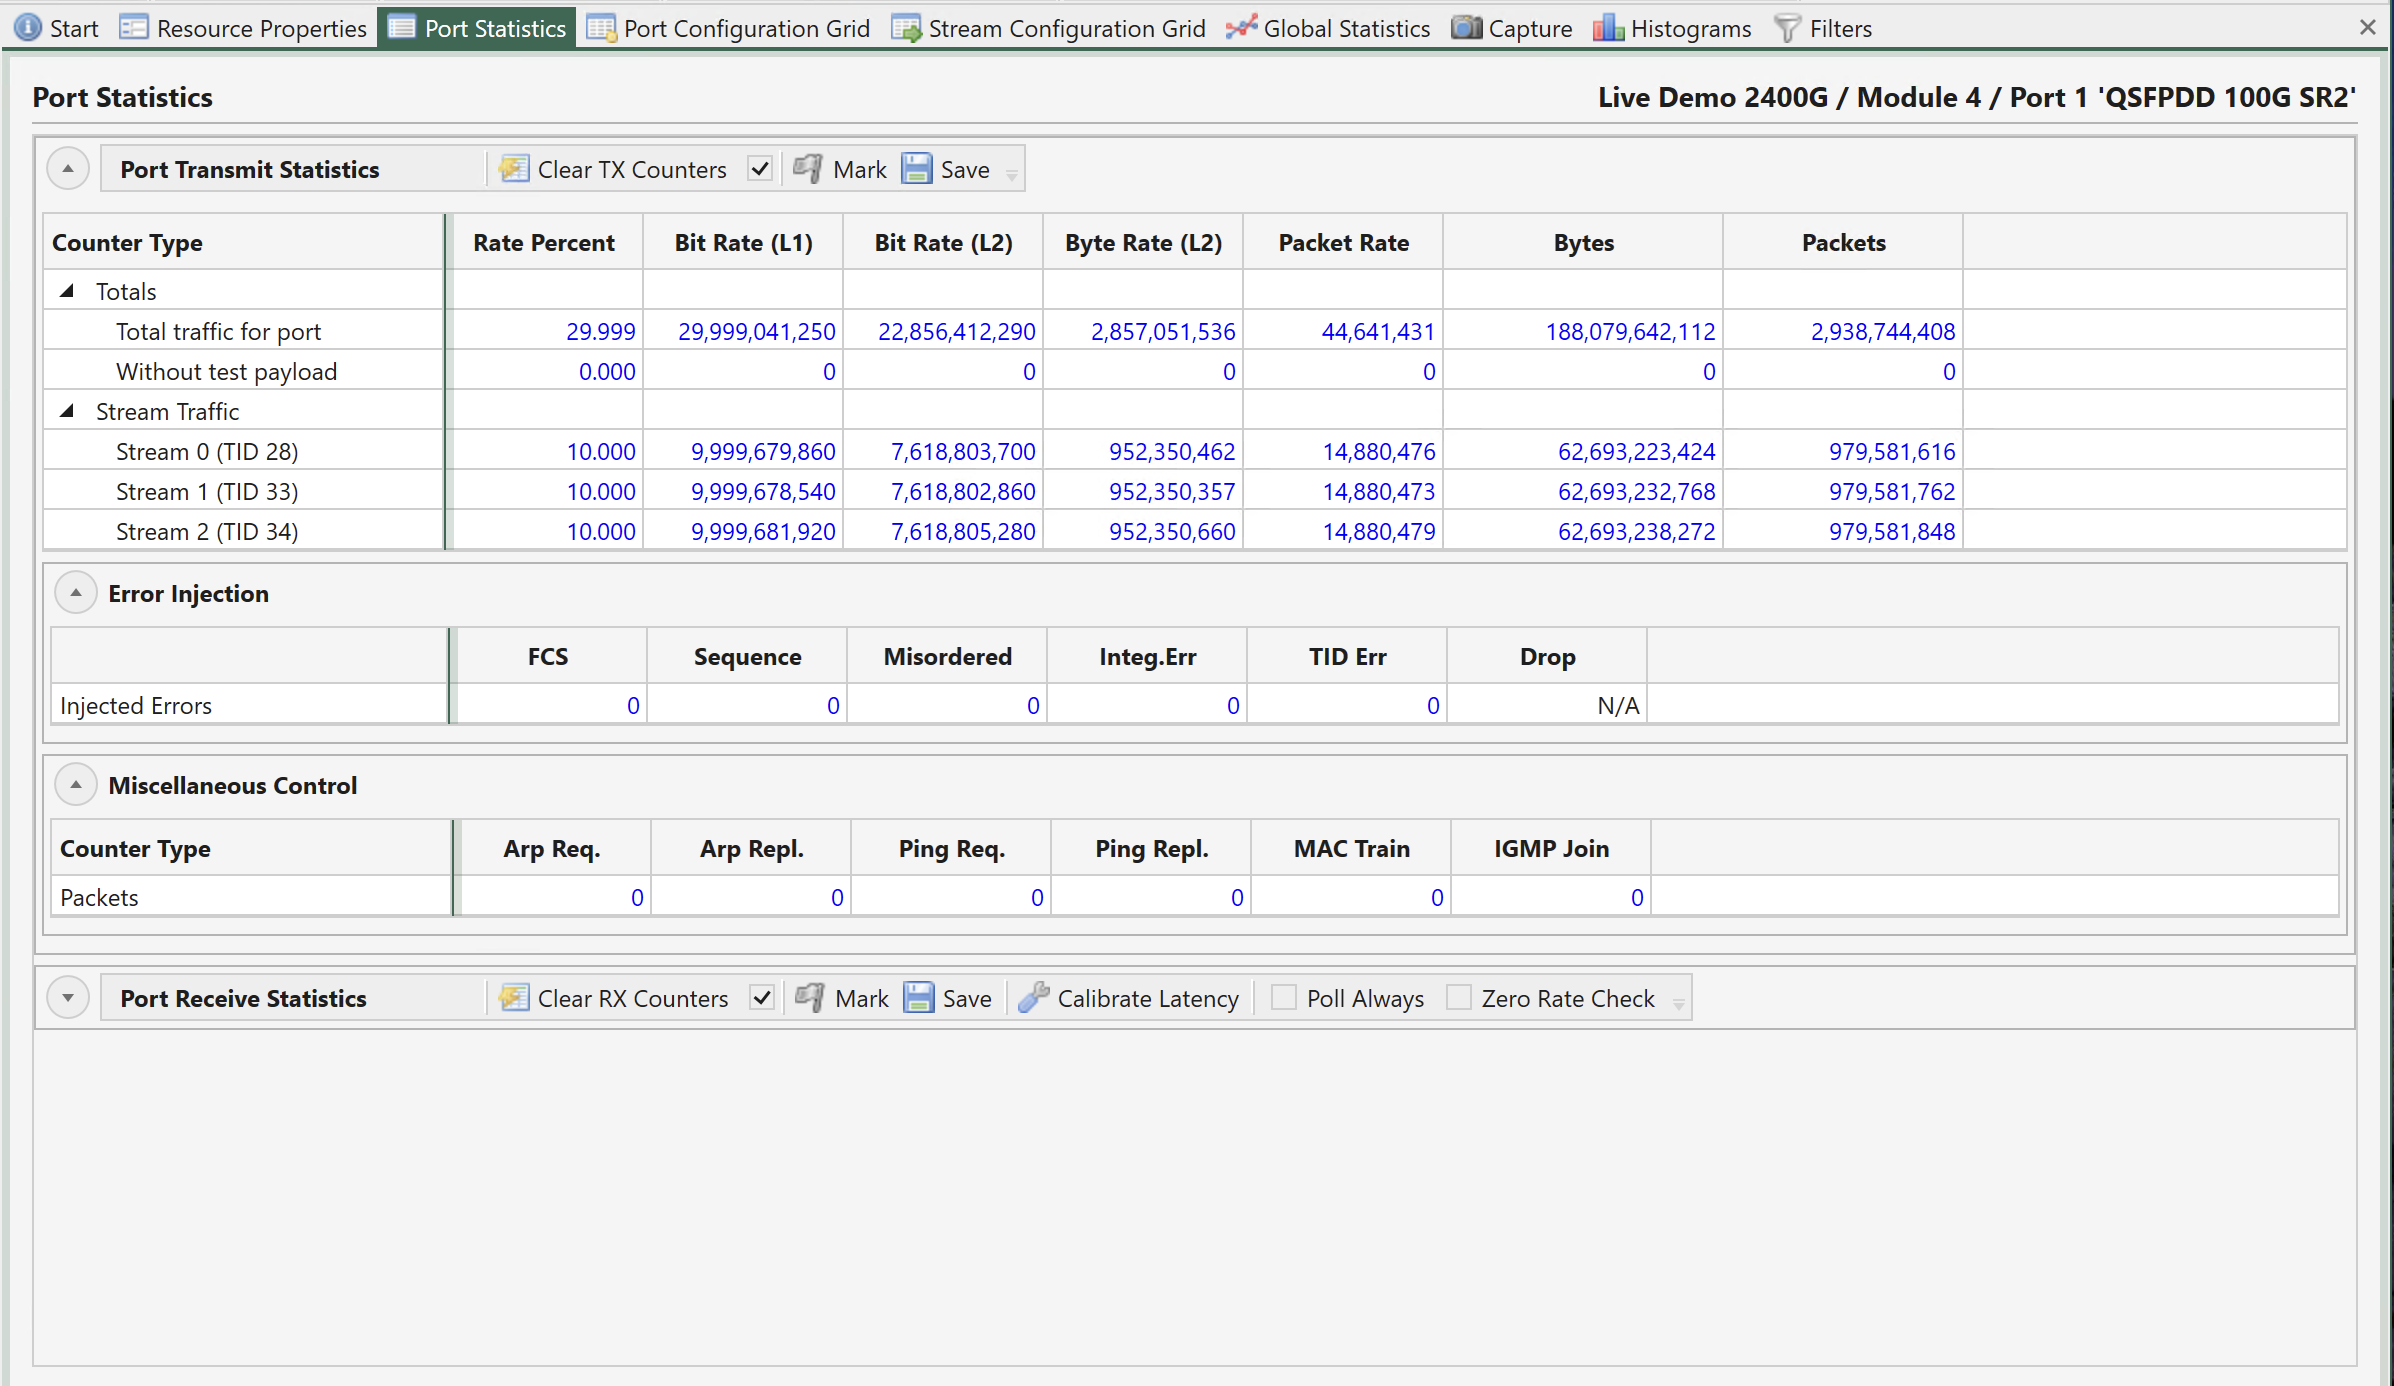
Fig. 5.124 Port TX statistics
Commands in TX Toolbar
The area contains a toolbar with the following commands:
Command |
Explanation |
|---|---|
Clear TX Counters |
Clear the current TX statistics counters for this port. |
(checkbox) |
If checked the TX statistics counters for this port will be affected when the Clear Statistics command is executed in the Global Statistics panel. |
Mark |
Set the font color of the current counter values to gray. Any counter value that changes afterwards will revert to blue. This makes it easy to check if a value changes over time. |
Save |
Allow you to save the current counters to a CSV text file. |
Main Transmit Statistics
Statistics Type |
Explanation |
|---|---|
Total Traffic for Port |
This row show statistics counters for all traffic transmitted on the port regardless of type. This is the sum of the traffic sent without test payload and the traffic sent for each active stream. |
Without Test Payload |
This row show statistics counters for the part of the transmitted traffic that is sent without test payload. |
Stream Traffic |
This branch contains a row for each stream currently active on the port. |
Common Column Header Functions
The two statistics tabs also share a common functionality with regard to the grid column headers. You can reorder the columns in the grid by dragging a column header to a new location. The new order will be remembered the next time you start XenaManager. The following options are available when right-clicking on the grid column headers:
Functions |
Explanation |
|---|---|
Hide Column |
Hide the selected column from view. This selection will be remembered the next time you start XenaManager. |
Reset Column Order |
Resets any custom column order you may have configured to the default order. |
View All Columns |
Show all columns you may have hidden previously. |
Error Injection
This section show the number of errors manually injected by the user for each possible error type.
Miscellaneous Control
This section show the number of transmitted ARP/NDP and PING requests and replies, MAC training packets and IGMP Joins.
MACSec TX Statistics
The MACSec TX statistics are grouped into the two tables.
The first table shows the statistics for the MACsec L2 counters.
Total TX for Port
Packets: Total number MACsec frames transmitted by the port since cleared.
Secure Channel TX
Packets: Total number MACsec frames transmitted by the TX SC since cleared.
The second table shows the statistics for the MACsec encryption-related counters.
Total TX for Port
Protected-Only Bits: The number of protected-only (non-encrypted) bits transmitted by the port since cleared.
Protected-Only Bytes: The number of protected-only (non-encrypted) bytes transmitted by the port since cleared.
Encrypted Bits: The number of encrypted bits transmitted by the port since cleared, excluding the bytes in the Confidentiality Offset.
Encrypted Bytes: The number of encrypted bytes transmitted by the port since cleared, excluding the bytes in the Confidentiality Offset.
5.4.2. Port RX Statistics
This area contains statistics for all data received by the port.
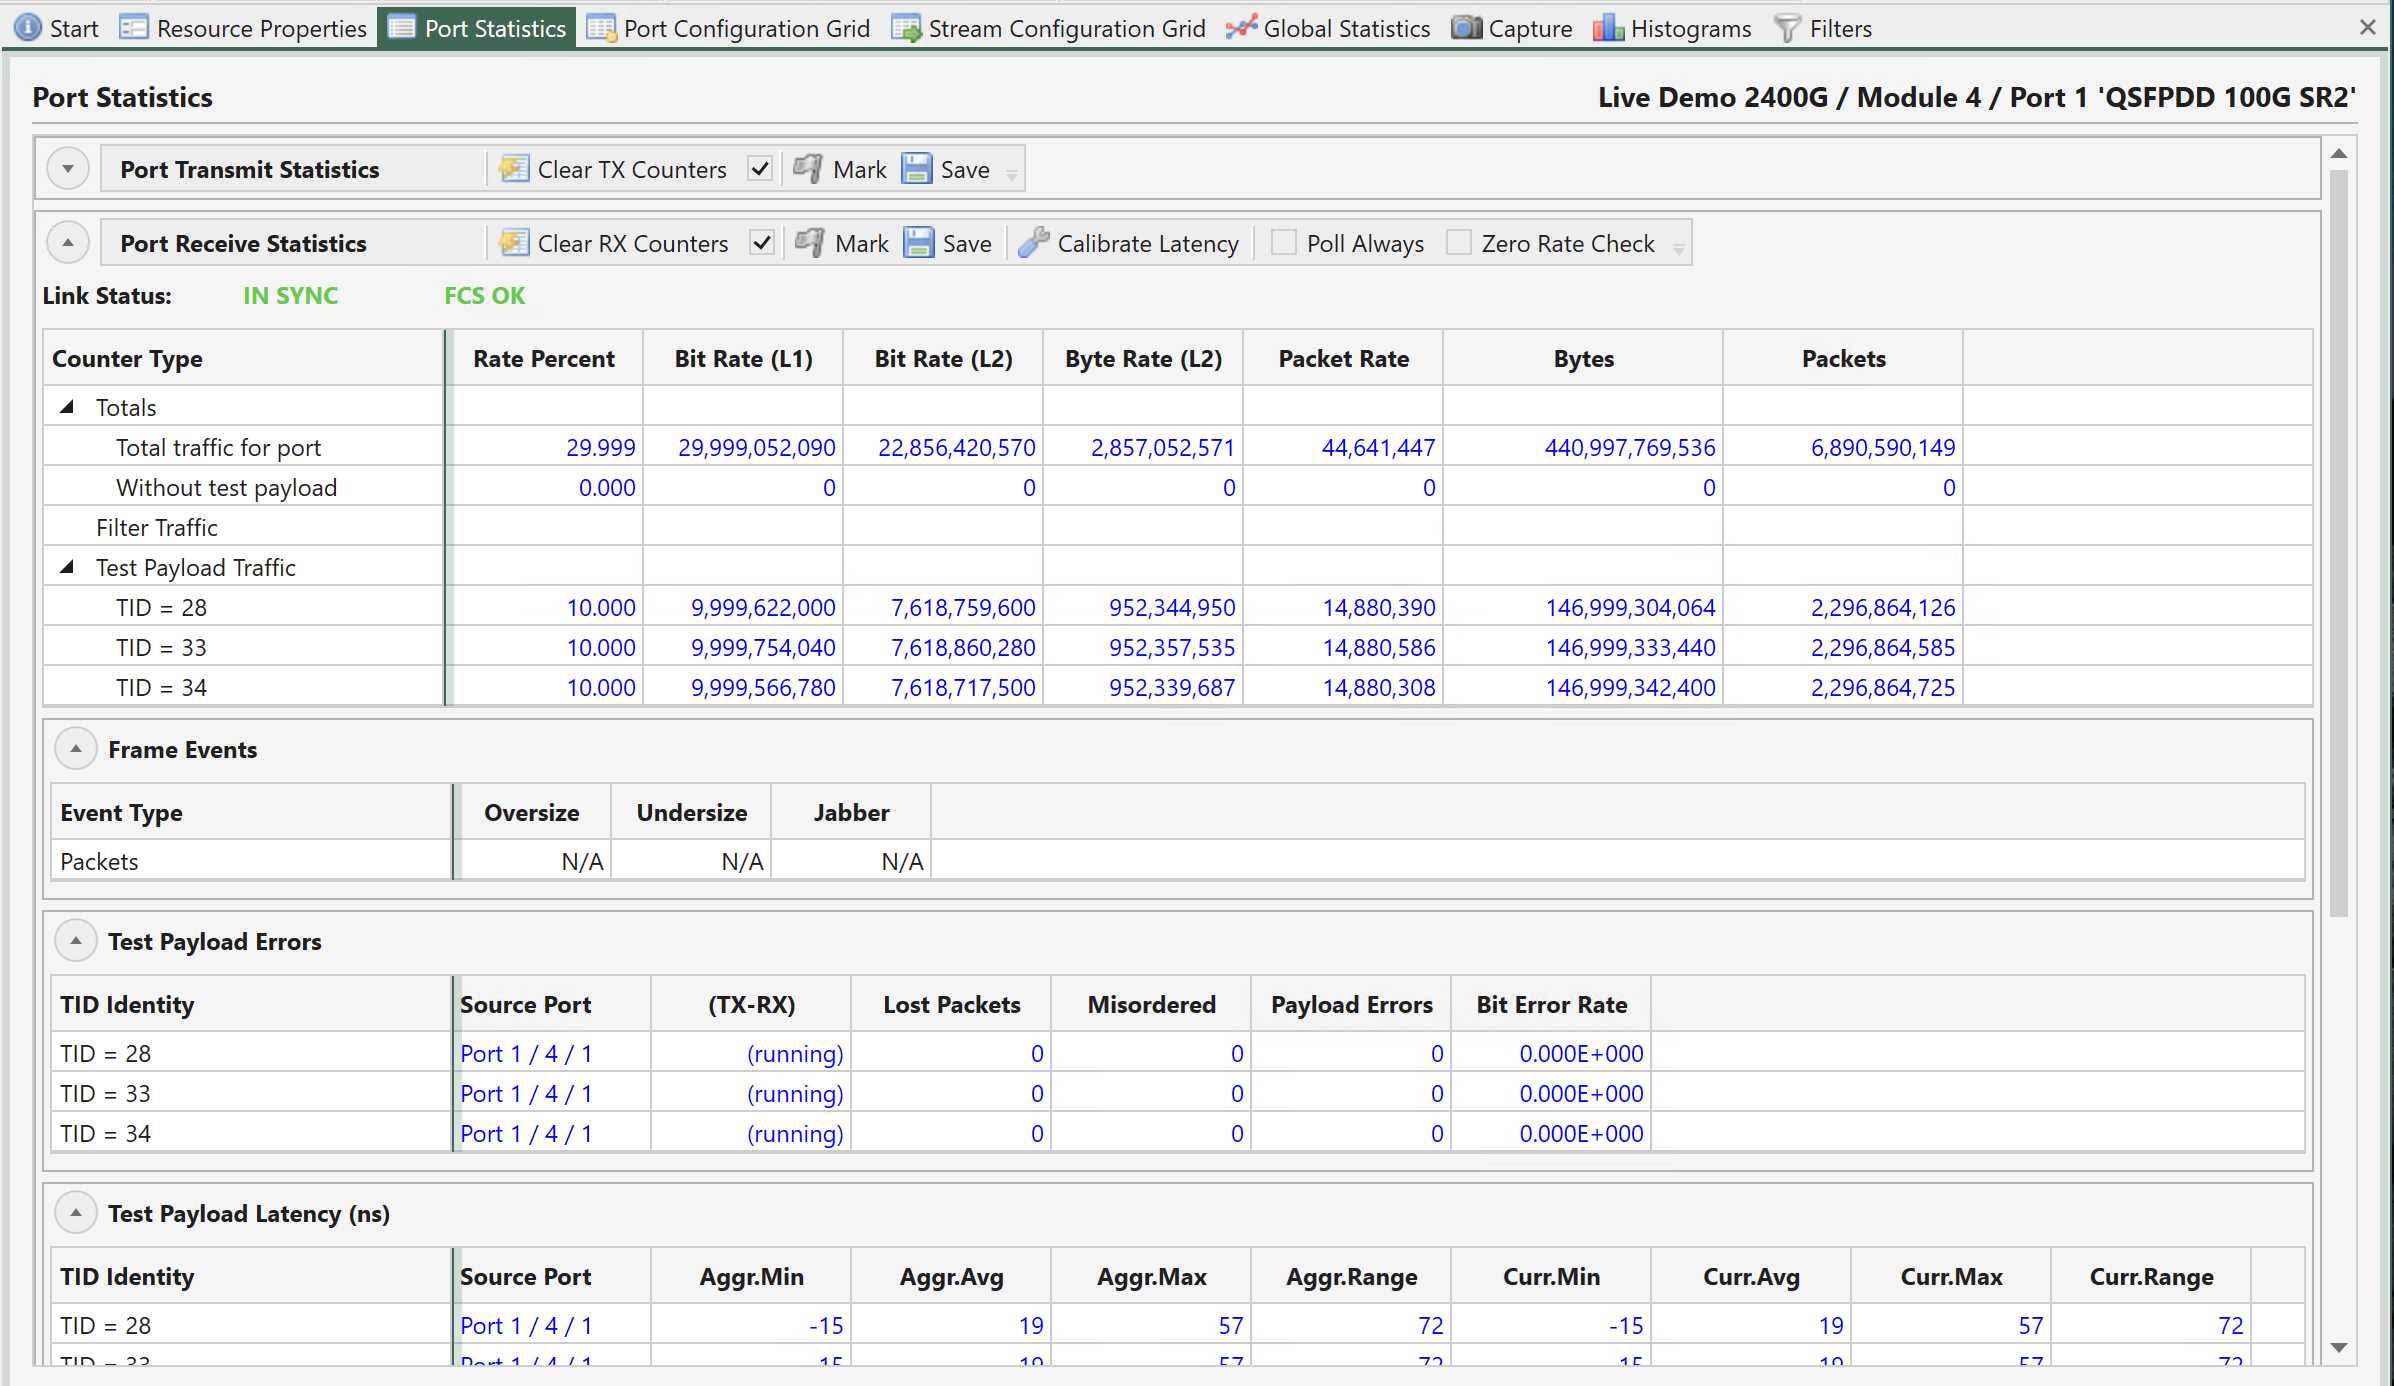
Fig. 5.125 Port RX statistics
Commands in RX Toolbar
The area contains a toolbar with the following commands:
Command |
Explanation |
|---|---|
Clear RX Counters |
Clear the current RX statistics counters for this port. |
(checkbox) |
If checked the RX statistics counters for this port will be affected when the Clear Statistics command is executed in the Global Statistics panel. |
Mark |
Set the font color of the current counter values to gray. Any counter value that changes afterwards will revert to blue. This makes it easy to check if a value changes over time. |
Save |
Allow you to save the current counters to a CSV text file. |
Calibrate Latency |
When pressed the current average latency value will be saved as the calibrated latency offset. |
Poll Always |
Normally a port is only polled for statistics counters when it is visible in a statistics panel, such as this panel or the Global Statistics panel. But if you want the port to be polled always you can check this box. This function can be useful if you want to monitor the state of the port over a long period of time. |
Main Receive Statistics
Statistics Type |
Explanation |
|---|---|
Total Traffic for Port |
This row show statistics counters for all traffic received on the port regardless of type. This is the sum of the traffic received without test payload and the traffic received for each TID. |
Without Test Payload |
This row show statistics counters for the part of the received traffic that is sent without test payload. |
Filter Traffic |
This branch contains a row for each active filter on the port. |
Test Payload Traffic |
This branch contains a row for each TID received on the port. |
Frame Events |
Shows number of Oversize, Undersize and jabber packets. |
Test Payload Specific Counters
A number of sections show counters received for each TID:
Counter Type |
Explanation |
|---|---|
Test Payload Errors |
This section contain a row for the payload errors received for each TID on the port. |
Test Payload Latency |
This section contain a row for the payload latency measured for each TID on the port. |
Test Payload Jitter |
This section contain a row for the payload jitter measured for each TID on the port. |
Misc. Counters
This section show statistics for various other counter types.
Counter Type |
Explanation |
|---|---|
Arp Req. |
Received ARP/NDP requests |
Arp Repl. |
Received ARP/NDP replies |
Ping Req. |
Received PING requests |
Ping Repl. |
Received PING replies |
FCS Errors |
Received packets with FCS errors |
PAUSE |
Received PAUSE frames |
Gap Count |
Number of gap counts detected |
Gap Dur. |
Current detected gap duration |
MACSec RX Statistics
The MACSec RX statistics are grouped into the two tables.
The first table shows the statistics for the MACsec L2 counters.
Total RX for Port
Packets: Total number MACsec frames received by the port since cleared.
Secure Channel RX
Packets: Total number MACsec frames received by the TX SC since cleared.
The second table shows the RX statistics for the MACsec encryption-related counters.
Total RX for Port
Good Packets: The number of good MACsec frames received by the port since cleared.
Delayed Packets: The number of frames with the PN lower than the minmum expected by the port since cleared.
ICV Check Failed Packets: The number of frames with ICV check failed recevied by the port since cleared.
Secure Channel RX
Good Packets: The number of good MACsec frames received by the RX SC since cleared.
Delayed Packets: The number of frames with the PN lower than the minmum expected by the RX SC since cleared.
ICV Check Failed Packets: The number of frames with ICV check failed recevied by the RX SC since cleared.