5.13. Communication Trace
This section describes the XenaManager Communication Trace panel. This panel show the decoded communication with connected chassis using Xena Management Protocol (XMP), which is Xena’s proprietary protocol for administrating chassis.
The panel is mainly used for debugging the communication in case of problems but it can also be used as a help for users writing automation scripts who wants to see how a certain request is formatted.
For details on the XMP requests please refer to the XOA CLI Documentation.
5.13.1. Trace Format
The trace entries are displayed in a standard grid view as shown below. Each request or reply is listed in a separate row in the grid. Requests sent from the XenaManager are shown in green whereas successfully replies from the chassis are shown in blue. Error replies from the chassis are shown in red.
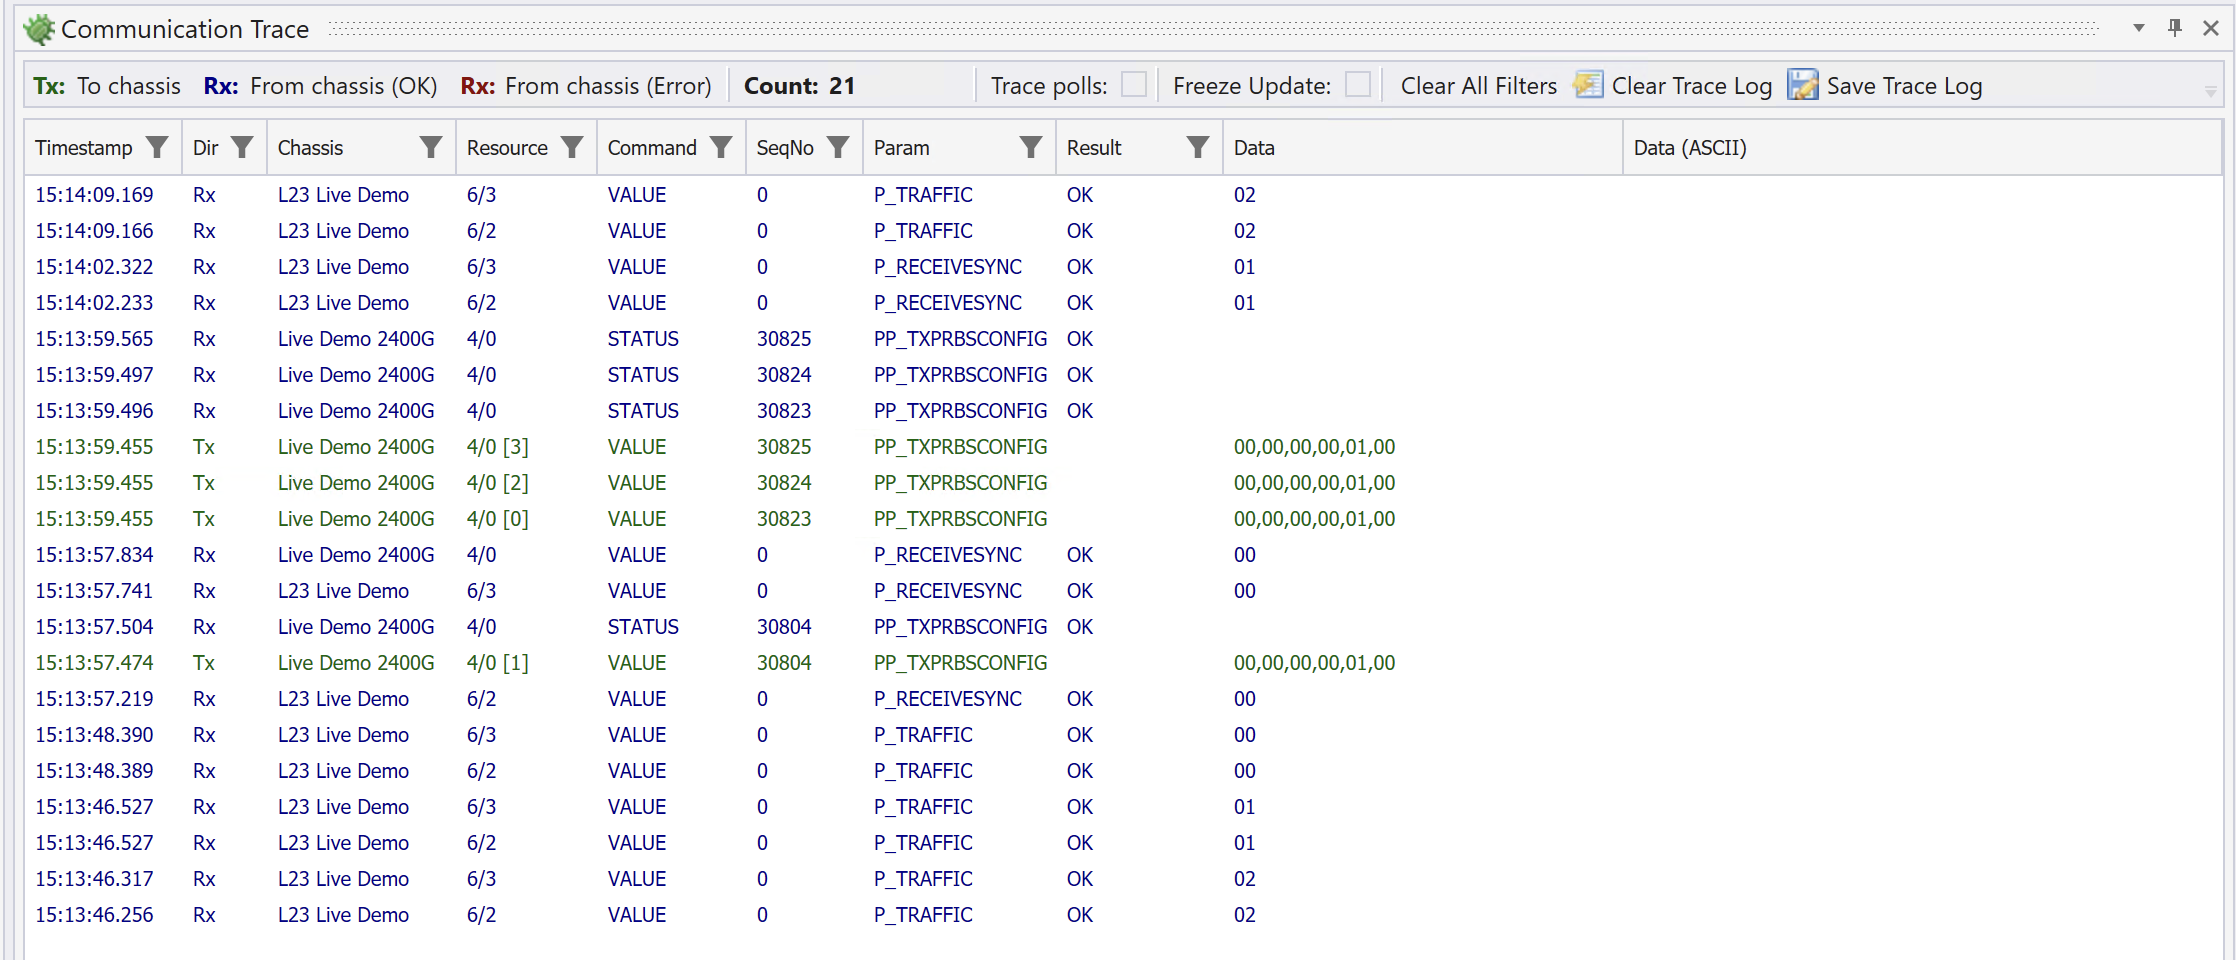
Fig. 5.137 Communication trace
5.13.2. Available Columns
The trace grid view offers the following columns:
Time: A timestamp for the trace event with millisecond accuracy.
Dir: The direction (Tx or Rx).
ChassisName: Name of the chassis
Target: The request target on the form
<module index>/<port index> [optional stream index].Command: The XMP command type
SeqNo: The XMP sequence number.
Param: The XMP request parameter.
Arguments: Any arguments as a list of hexadecimal numbers
Result: The result code for a reply.
5.13.3. Filtering
Several column provide support for filtering the displayed trace messages. This is indicated by the funnel icon in the column header. If you click this icon you can select how you want to filter the displayed trace messages.
5.13.4. Performance Impact
Having the panel open at all times is usually not recommended. If a lot of traffic is going to and from the chassis this may impact the performance of the PC, especially during polling.