5.14. Logging and Reporting
Note
Chimera module and its ports for network impairment measurement also offer support for logging and reporting functionalities.
5.14.1. Overview
The Logging and Reporting function allows you to periodically poll statistics counters for all ports in a testbed and log those counters to a CSV or XML file.
Port Scope
The logging function works on all ports in a given testbed. You can enable logging on multiple testbeds at the same time.
Configuration Panel
This function is handled by the Logging and Reporting panel as shown in Fig. 5.138. This panel is by default shown in the bottom part as one of the auto-hide panels.
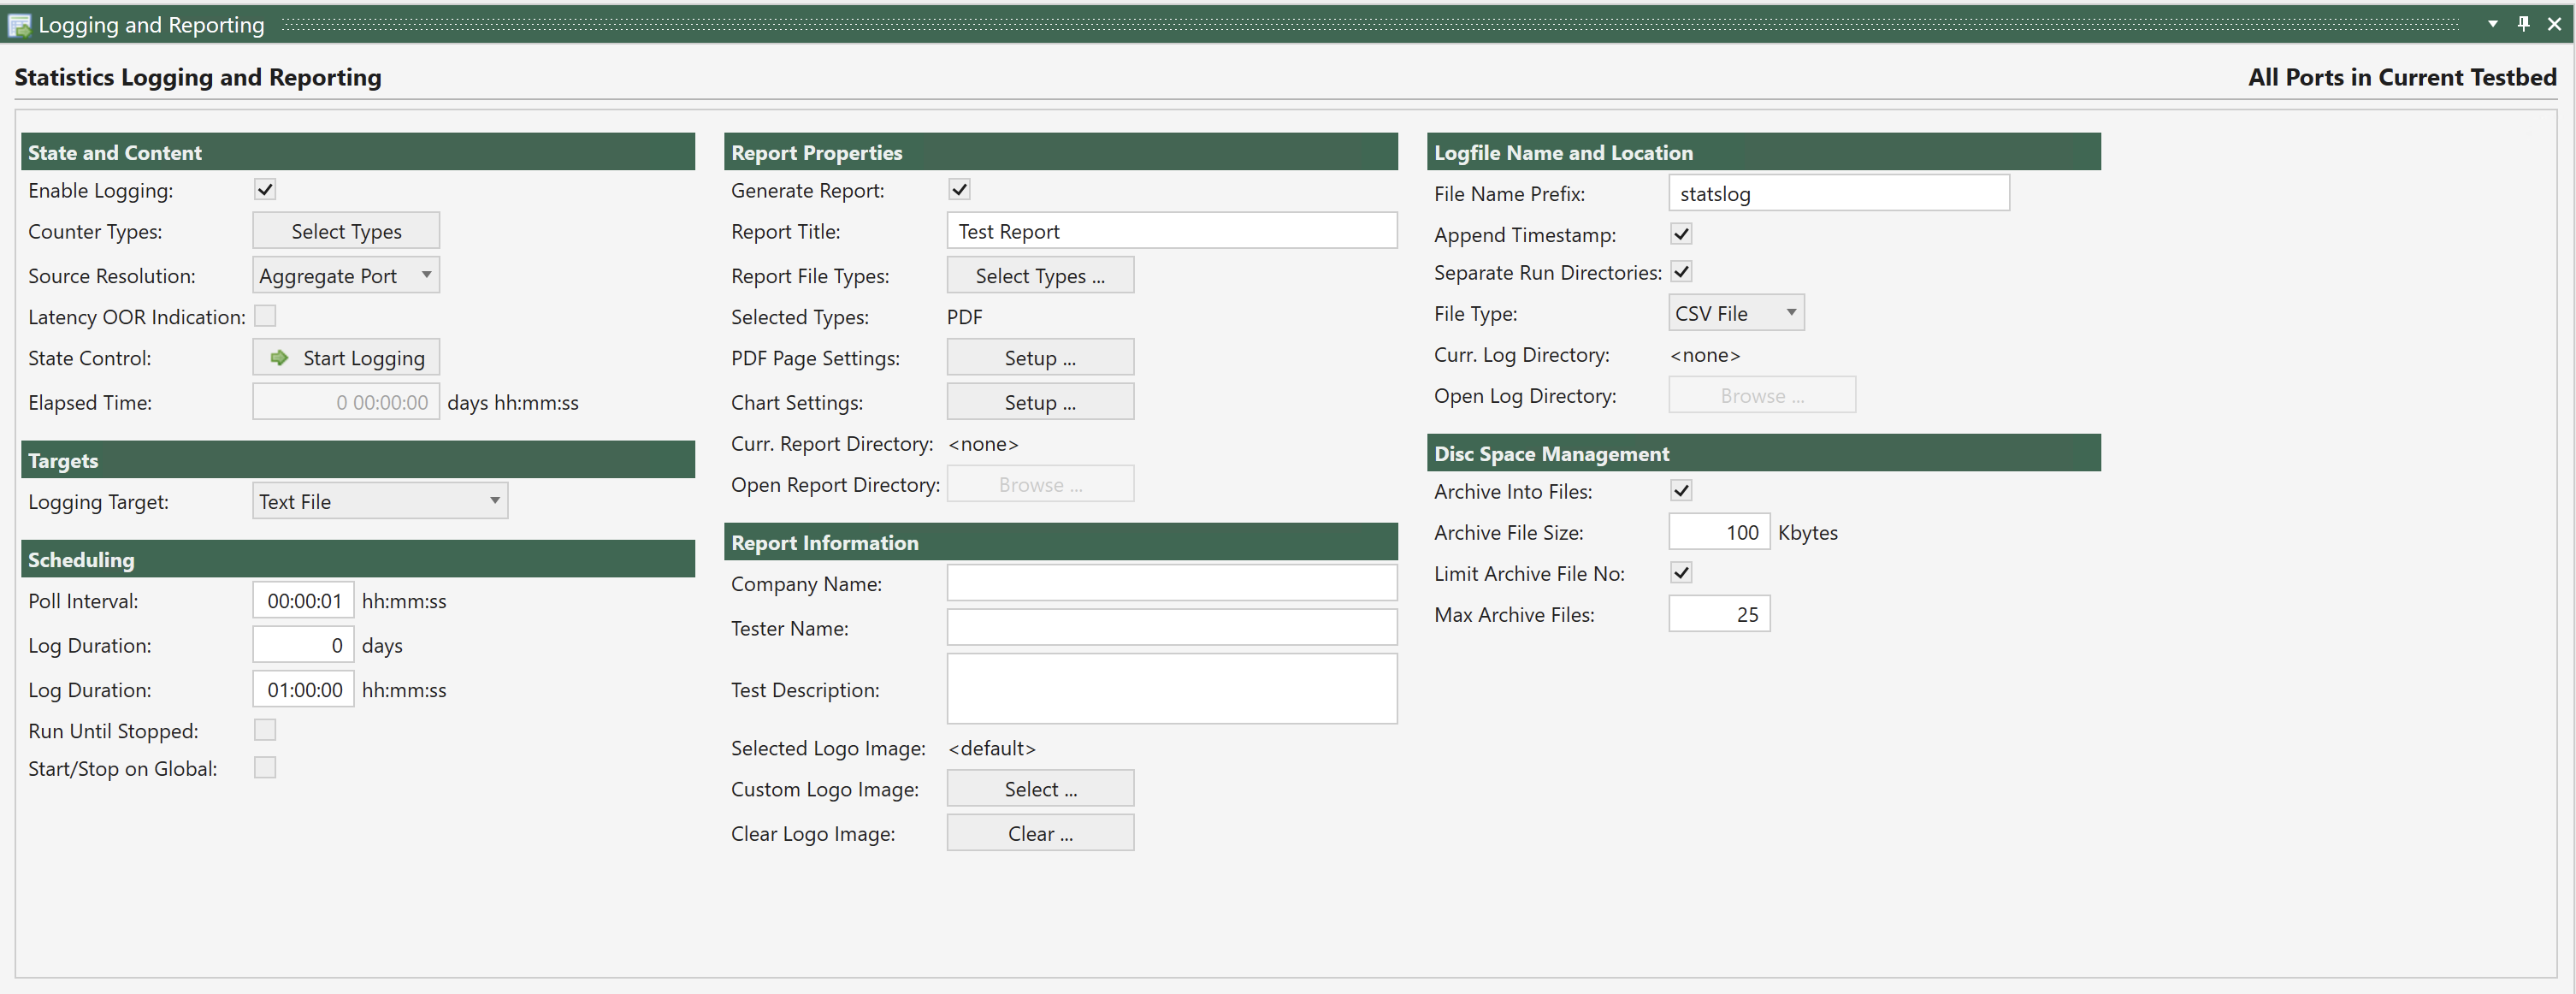
Fig. 5.138 Logging and Reporting and Report tab
Logging Configuration
The Logging and Reporting panel provides the following configuration options:
Option |
Explanation |
|---|---|
Enable Logging |
Selects whether this Logging and Reporting definition is enabled or not. |
Counter Types |
Pressing this button will enable you to select which counters to include in the log. See Counter Types for the detailed description of the available counter types. |
State Control |
This button will either start or stop a logging session. |
Elapsed Time |
Shows the elapsed time for an active logging session. |
Poll Interval |
Specifies the interval between polls. The default value is 1 second. The minimum value is 1 second. |
Log Duration |
Specifies the total desired duration of a collection period. You can specify this duration as a number of days + a |
Run Until Stopped |
If this option is selected the collection will run until it is manually stopped. |
File Name Prefix |
This string will be used as the prefix for the logging filenames. |
Append Timestamp |
If selected a timestamp on the form |
Separate Run Directories |
All log files will be located under the <ProgramData>XenaXenaIntegratorPortLog directory. If this option is selected the log files for different logging runs will be placed in separate subdirectories under this master directory. The subdirectory name will be a timestamp on the form |
File Type |
This determines the format of the log ile. You can select between CSV (Comma Separated Value) or XML format. |
Archive Large Files |
Selecting this option will make the logging function save the current log file to an archive file and start a new log file when the log file reaches a certain size.
The archive files will be named |
Limit Archive File No |
If this option is selected the application will limit the number of archive files for a single logging run. This can be used for long-running logging tasks to prevent the hard disk from filling up. |
Max. Archive Files |
The maximum number of archive files to keep. This option is only valid if the Limit Archive File No option is selected. |
Counter Types
The following counter types are available:
Transmit Rate L1 (Bit/s)
Transmit Rate (Bit/s)
Transmit Rate (Byte/s)
Transmit Rate (Fps)
Transmitted Bytes
Transmitted Frames
Receive Rate L1 (Bit/s)
Receive Rate (Bit/s)
Receive Rate (Byte/s)
Receive Rate (Fps)
Received Bytes
Received Frames
RX Oversize Packets
RX Undersize Packets
RX Jabber Packets
Transmitted Non-Payload Bytes
Transmitted Non-Payload Frames
Received Non-Payload Bytes
Received Non-Payload Frames
Received FCS Errors
Rx Sequence Errors
Rx Packet Loss Ratio
Rx Sequence Misorders
Rx Payload Errors
Rx Bit Error Rate (aggregated)
Rx Bit Error Rate (current)
Latency - 1 sec. avg (ns)
Latency - 1 sec. min (ns)
Latency - 1 sec. max (ns)
Latency - aggr.avg (ns)
Latency - aggr.min (ns)
Latency - aggr.max (ns)
Jitter - 1 sec. avg (ns)
Jitter - 1 sec. min (ns)
Jitter - 1 sec. max (ns)
Jitter - aggr.avg (ns)
Jitter - aggr.min (ns)
Jitter - aggr.max (ns)
Transmitted ARP Requests
Transmitted ARP Replies
Transmitted PING Requests
Transmitted PING Replies
Injected FCS Errors
Injected SEQ Errors
Injected MIS Errors
Injected Integ. Errors
Injected TID Errors
Transmitted MAC Training Frames
Transmitted IGMP Join
Received ARP Requests
Received ARP Replies
Received PING Requests
Received PING Replies
Calculated Gap Count
Calculated Gap Duration
Received PAUSE Frames
Received PFC Frames
Received PFC Quanta CoS 0
Received PFC Quanta CoS 1
Received PFC Quanta CoS 2
Received PFC Quanta CoS 3
Received PFC Quanta CoS 4
Received PFC Quanta CoS 5
Received PFC Quanta CoS 6
Received PFC Quanta CoS 7
Chimera Total Packet Drop
Chimera Total Packet Drop Ratio (ppm)
Chimera Programmed Drop
Chimera Programmed Drop Ratio (ppm)
Chimera Bandwidth Drop
Chimera Bandwidth Drop Ratio (ppm)
Chimera Other Drops
Chimera Other Drops Ratio (ppm)
Chimera Misordering
Chimera Misordering Ratio (ppm)
Chimera Duplication
Chimera Duplication Ratio (ppm)
Chimera Corruption
Chimera Corruption Ratio (ppm)
Chimera FCS Checksum
Chimera FCS Checksum Ratio (ppm)
Chimera IP Checksum
Chimera IP Checksum Ratio (ppm)
Chimera UDP Checksum
Chimera UDP Checksum Ratio (ppm)
Chimera TCP Checksum
Chimera TCP Checksum Ratio (ppm)
TSN offset pre-servo average last second.
TSN offset post-servo average last second.
TSN Rx interarrival average last second.
TSN P delay average last second.
TSN Neighbor Rate Ratio average last second.
Received Lane Pre-FEC BER
Total uncorrected FEC blocks count
Total corrected FEC symbols count
Estimated received Pre-FEC BER
Estimated received Post-FEC BER
Received FEC blocks stats
Received FEC blocks ratio stats
Importing Legacy XenaIntegrator Configurations
It is possible to import a legacy XenaIntegrator Port Logging Definition as a new XenaManager testbed. Since the XenaIntegrator Port Logging Definition contains a definition of the ports which will provide the logging counters the import process will automatically perform the following steps:
Check if the Xena chassis defined in the legacy configuration are already defined in the XenaManager configuration. If not, the necessary chassis definition will be created.
Create a new testbed with the name
Testbed XI: <definition label>where<definition label>is the name originally used for the Port Logging Definition in XenaIntegrator.Add the defined logging ports to the new testbed.
Migrate the other logging configuration to the new testbed.
To import a legacy XenaIntegrator Port Logging Definition simply click the Import XI LogCfg button in the Operations menu and select the XenaIntegrator configuration file you want to import.
5.14.2. Controlling Logging State
Starting and Stopping Logging
As stated above the State Control button allows you to start or stop the logging process. While the logging is in progress it will not be possible to change any configuration parameters.
Monitoring Progress
While the logging is in progress the Elapsed Time counter will increment showing the total duration of the logging process. The Current Log Directory field will show the full path to the current logging directory. Clicking the Open Log Directory button will launch a Windows Explorer in this directory.
5.14.3. Output Formats
CSV File Format
The CSV file will contain a number of lines. Each line will represent all enabled logging data for one port for a single poll. A line will have the following format:
<Timestamp>, <Port ID>, { <CounterValue>, }*
Field |
Explanation |
|---|---|
Timestamp |
The data and time for the logged data line on the form |
Port ID |
The port identification on the form |
CounterValue |
The counter value. All values are expressed as a decimal number. |
The file will also contain a header row describing the selected counter types.
XML File Format
The XML file format will be similar to the following example:
<?xml version="1.0" encoding="utf-8"?>
<!--XenaIntegrator Statistics Counters-->
<PollSamples>
    <SelectedCounterTypes Values="TxBps,TxFps,TxBytes,TxFrames,RxBps,RxFps,RxBytes,RxFrames" />
    <Element Timestamp="20130331-174155" Type="Notification" Text="Log initialized" />
    <Element Timestamp="20130331-174156" Type="Sample" Port="P-0-10-2" Values="0,0,0,0,0,0,2.91E+06,4.3E+04" />
    <Element Timestamp="20130331-174156" Type="Sample" Port="P-0-10-3" Values="0,0,0,0,0,0,1.51E+05,581" />

    <etc>
</PollSamples>
All data is kept under a root tag called <PollSamples>.
The first node is called <SelectedCounterTypes>. The Value attribute describes the selected counter types in comma-separated format.
Each poll sample is represented using the <Element> node tag and has the Type attribute set to Sample. The Values attribute contains the sample values in the same order as is given by the <SelectedCounterTypes> tag.
<Element> nodes with Type = Notification represents notification messages.