5.7. Global Statistics
This section describes the XenaManager Global Statistics panel.
5.7.1. Overview
The Global Statistics panel show all ports and streams currently in your testbed. It does not show any other ports (or streams on these ports), not even if they have been reserved by you.
5.7.2. Statistics Tabs
The panel is divided into two tabs, Port Statistics and Stream Statistics. The first tab show testbed-global Port Statistics and the other show testbed-global Stream Statistics.
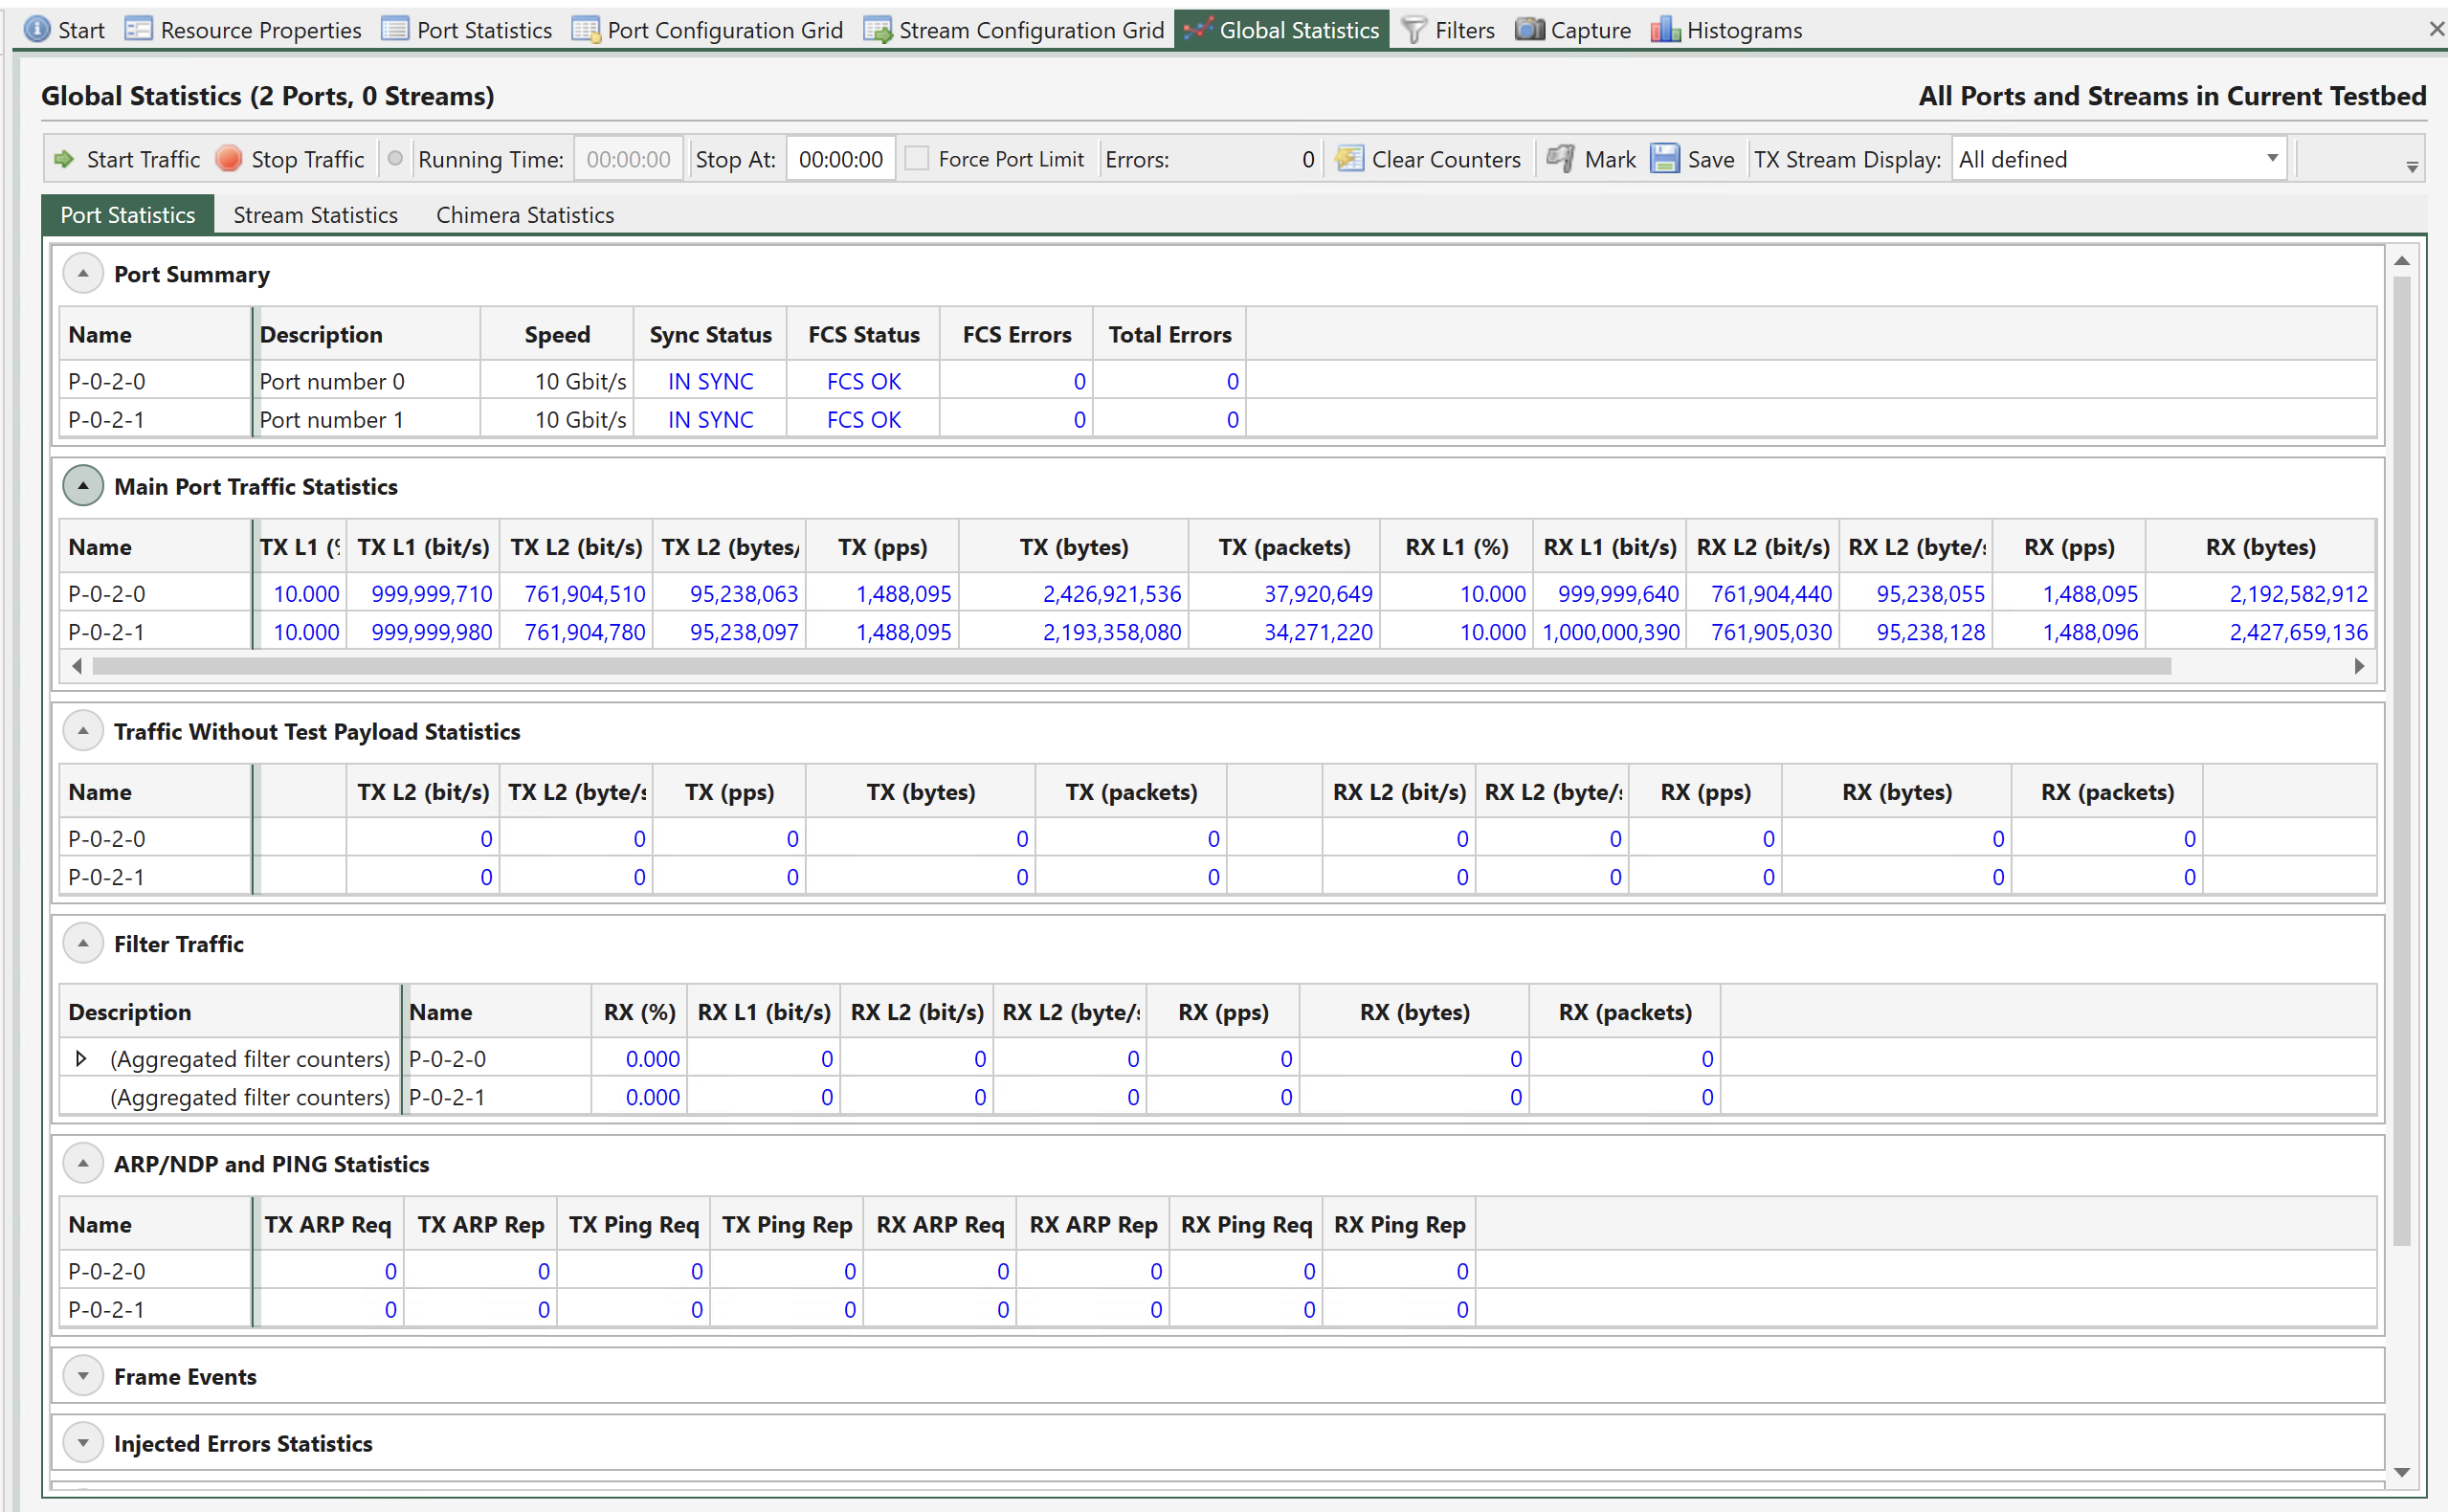
Fig. 5.128 Global Statistics - Port Statistics
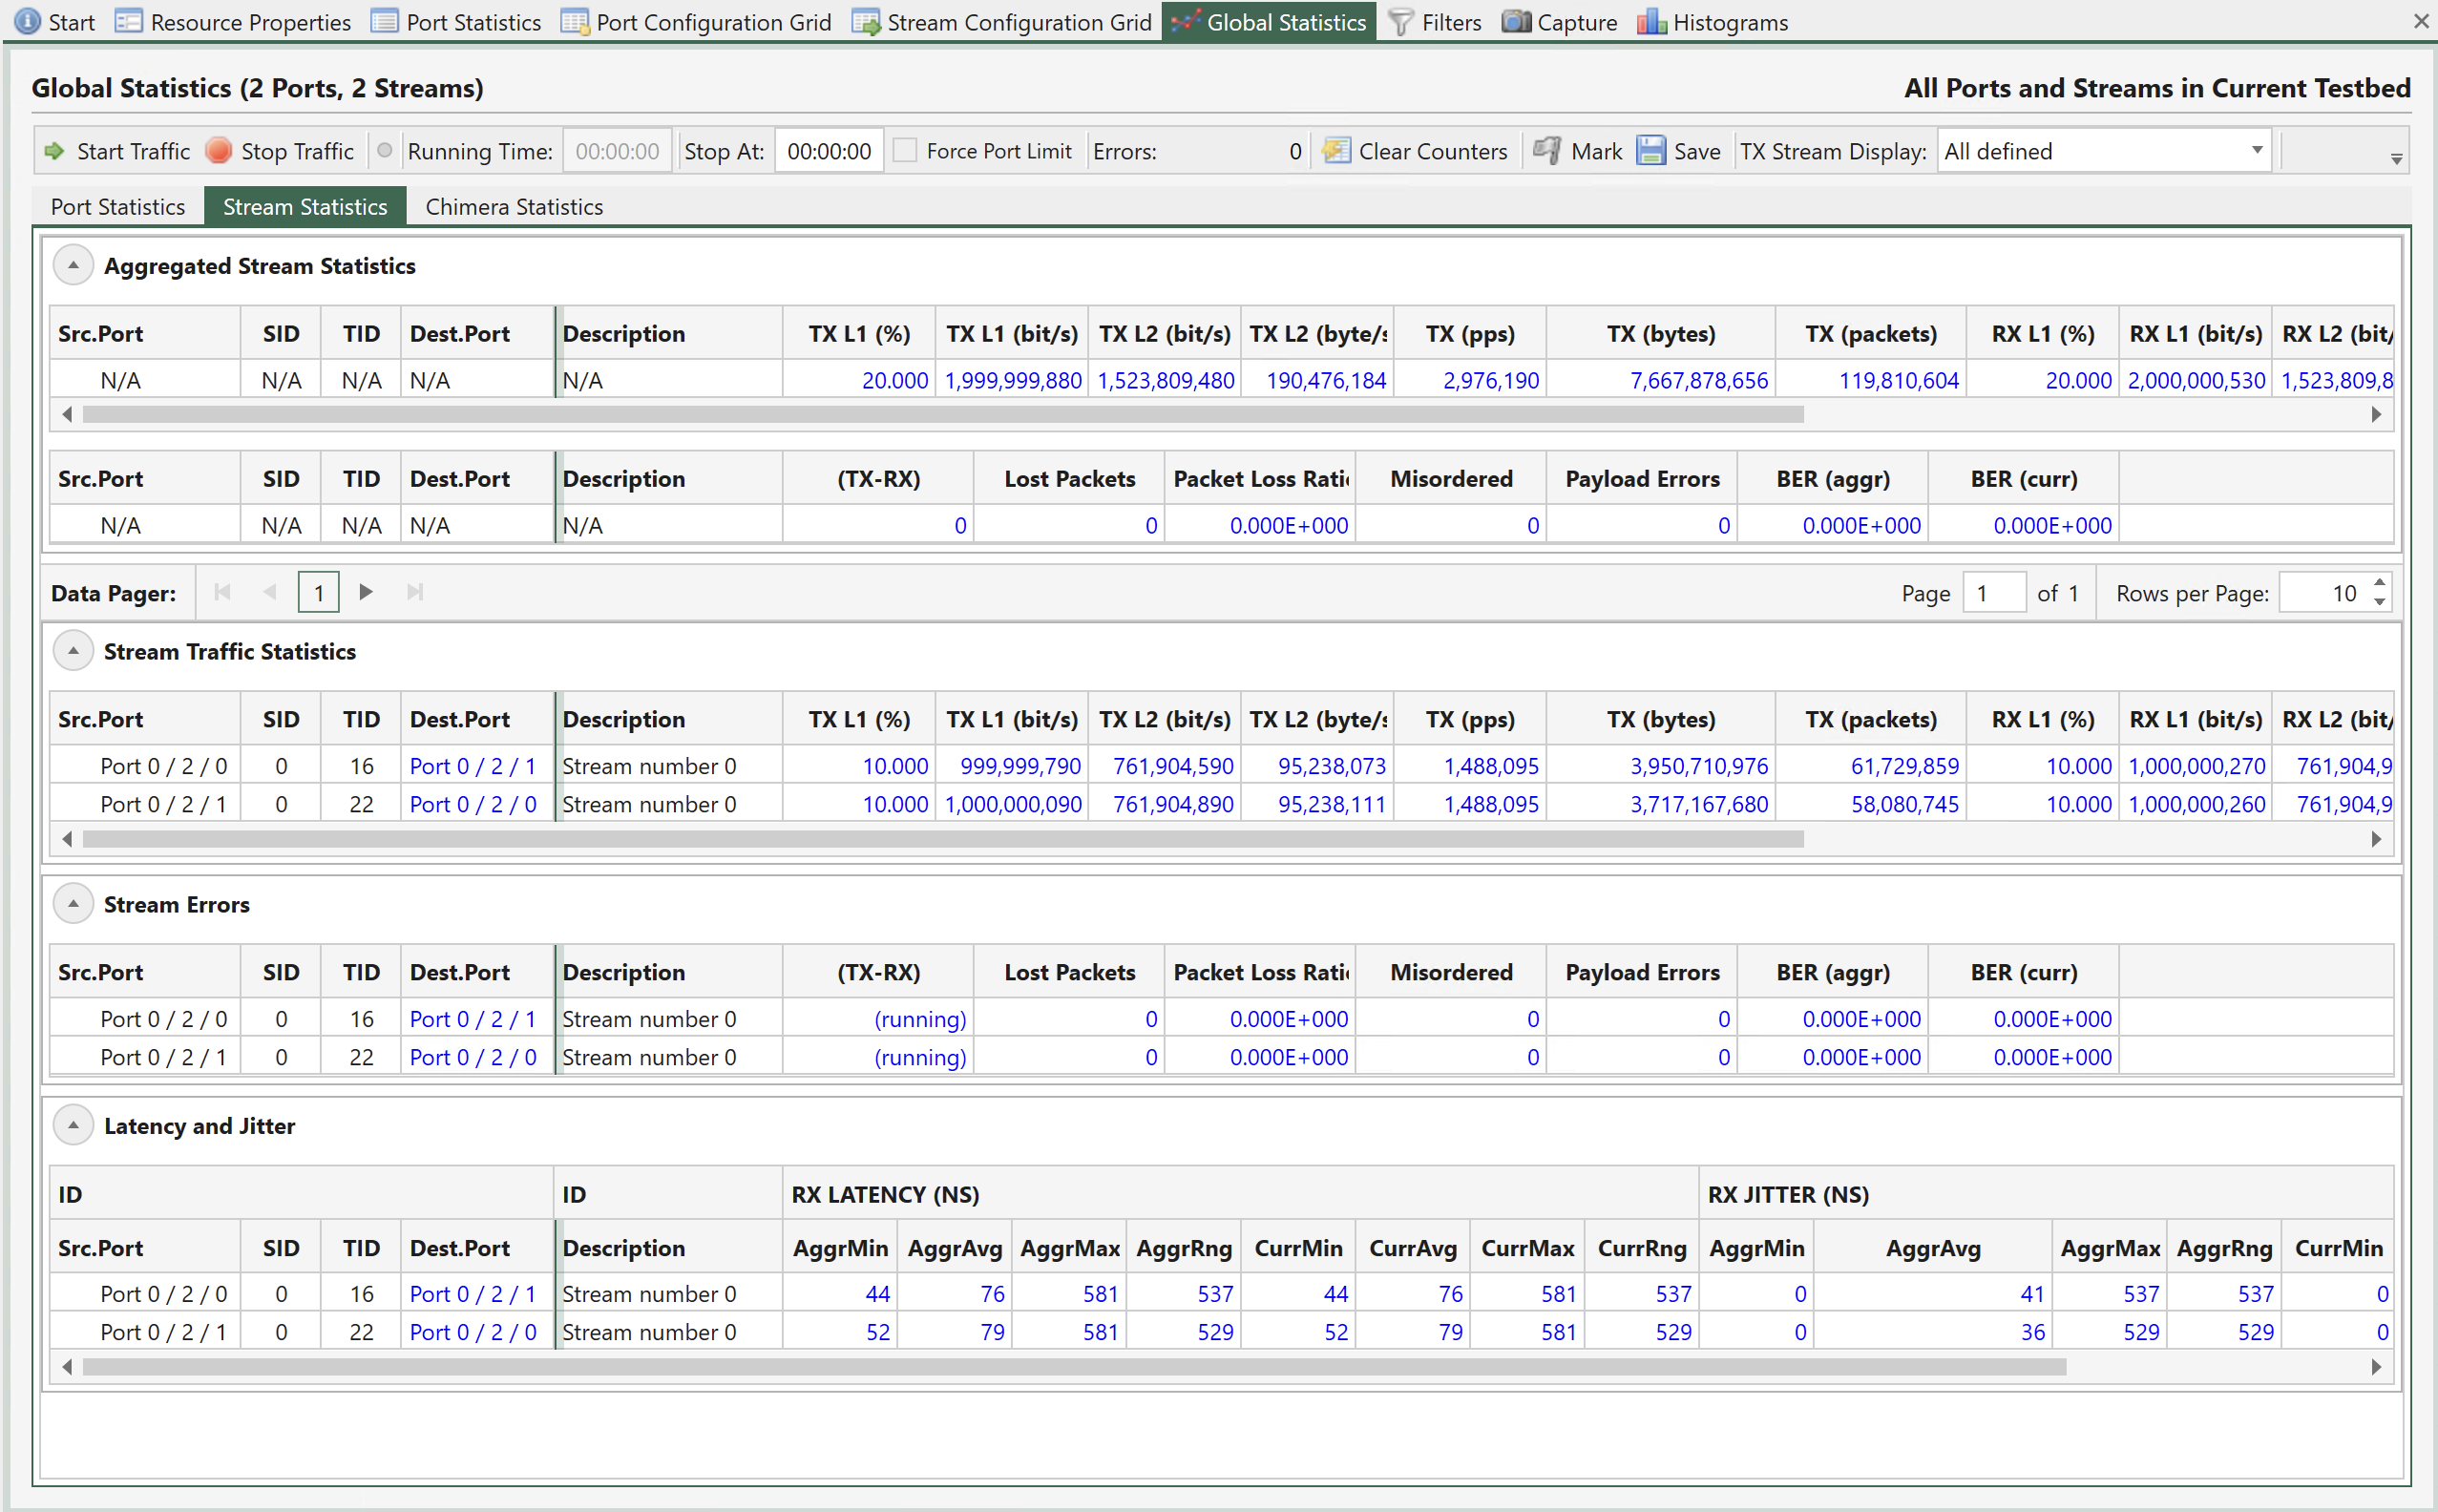
Fig. 5.129 Global Statistics - Stream Statistics
Common Toolbar Functions
The two statistics tabs share a common toolbar with the following functions:
Function |
Explanation |
|---|---|
Start Traffic |
Start traffic on all ports in your testbed. Ports that are already transmitting are not affected. This command may also affect any capture and histograms defined for the ports if you have enabled it. |
Stop Traffic |
Stop traffic on all ports in your testbed. Ports that are not transmitting are not affected. This command may also affect any capture and histograms defined for the ports if you have enabled it. |
Running Time |
Show the amount of time that has elapsed since you performed a Start Traffic command in this panel. If an individual port had been started before this point in time this is not reflected in the Running Time value. |
Stop At |
Allow you to specify a time limit for the port transmission. When the Running Time exceeds this value the port traffic will be automatically stopped. |
Errors |
Display the total number of errors on all ports in your testbed. |
Clear Counters |
Clear the current statistics counters for all streams on all ports. |
Mark |
Set the font color of the current counter values to gray. Any counter value that changes afterwards will revert to blue. This makes it easy to check if a value changes over time. |
Save |
Allow you to save the current counters to a CSV text file. |
Force Port Limit |
Force Port limit will apply Stop after to all the used ports. Note Force Port Limit will overwrite any TX Time Limit value configured on Port property page on the used ports, and use the Stop after value. |
Common Column Header Functions
The two statistics tabs also share a common functionality with regard to the grid column headers. You can reorder the columns in the grid by dragging a column header to a new location. The new order will be remembered the next time you start XenaManager. The following options are available when right-clicking on the grid column headers:
Function |
Explanation |
|---|---|
Hide Column |
Hide the selected column from view. This selection will be remembered the next time you start XenaManager. |
Reset Column Order |
Resets any custom column order you may have configured to the default order. |
View All Columns |
Show all columns you may have hidden previously. |
Port Statistics
The Port Statistics tab show statistics counters for all ports in your testbed. In general each port is represented by a single row which contain both Tx and Rx counters for that port.
Port Summary
The Port Summary section provides a brief overview of the main port state properties for the testbed ports.
Traffic Statistics Counters
The available statistics counters for each port are the same as for the individual port statistics page described in Port Statistics.
Stream Statistics
The Stream Statistics tab show statistics counters for all streams on all ports in your testbed. Each counter type is explained in the individual port statistics page described in Port Statistics.
TID Matching
The counters are shown in a grid view where each row represent both ends of a stream. The stream “ends” are matched together using the Test Payload ID (TID) which is configured on the stream at the transmit end and transferred to the received end within the Xena test payload inside each packet.
To enable an accurate matching of Tx and Rx stream ends it is imperative that the used TID values are unique within the testbed. Otherwise it will be impossible to determine which stream on which port was the sender of a given packet.
Aggregated Stream Statistics
This section show the aggregated counter values for all streams in the view.
Stream Traffic Statistics
This section show the main stream traffic counters for each stream.
Each row in the grid represents a test-stream end-to-end. The stream entity is identified by the TID value. The Tx counter values are read from the transmitting port and the Rx counter values are read form the receiving port.
TID Conflicts
If two or more streams in your testbed use the same TID value the Stream Statistics grid will not be able to accurately determine where the various TID contributions originate from on the receiving side. The grid will show this situation as a single parent row representing all receive-side contributions from the given TID value. The transmit-side contributions will be shown as N/A.The source port will be shown as Multiple.
Each transmit-side contribution will be listed as a child row. You can expand the child rows by clicking the expander icon to the left of the row.
Stream Errors
The Stream Errors section show the errors detected for each end-to-end stream entity. The mechanism for showing TID conflicts explained above is also used here.
The following error counters are shown:
Name |
Explanation |
|---|---|
(TX-RX) |
The difference between the sent packets for the stream on the transmitting port and the received packets on the matching TID entry on the receiving port. This value is not accurate while the traffic is running as it is not possible to accurately read TX and RX counters on different ports at the exact same time. So this value is only shown when traffic is stopped. |
Lost Packets |
The calculated loss based on the embedded sequence number in the test payload section in the received packets. This value is somewhat accurate while the traffic is running. It is especially good at detecting on-going loss. But it cannot detect lost packets at the very start or at the very end of the packet stream since the receiver cannot know how many packets was sent before the first packet it receives or how many packets are actually lost after the last packet it receives. |
Misordered |
The number of misordered packets detected, i.e. packets arriving out of sequence compared to the embedded sequence number in the test payload section. The same uncertainly regarding packets at the very start or at the very end explained above applies here as well. |
Payload Errors |
The number of packets received that failed the test payload integrity check. These packets are not counted as lost or misordered as they strictly speaking are valid Ethernet packets. But their presence indicates that the DUT/SUT changed something in the payload section which caused the payload integrity check to fail. Payload Integrity Error detection is supported regardless of the Payload Type <stream-packet-content-label>. For Payload Types that are not Incrementing 8-bit, you need to set the same non-zero Payload Checksum Offset on both the TX and the RX ports |
Bit Error Rate |
This value is an estimated bit error rate (BER) measured at Layer-2 over the time span since the traffic counters was last cleared. The BER value provided is estimated based on the assumption that 1 errored packet equals 1 bit error. If more than one bit error occurred in one errored packet, this will not be detected by the Xena tester. Based on this assumption the estimated BER is calculated as follows by the XenaManager: BER = DroppedFrames * RxFrames / (8 * RxBytes) * (RxFrames + DroppedFrames)
|
Note
(TX-RX) packets gives packet loss results based on TX packets and RX packets.
RX packets can consist of two parts: RX_1 originated from the TX port, RX_2 duplicated by the DUT
(TX-RX) > 0:TX > RX_1+RX_2. Transmitted packets more than received even if there is duplication from the DUT.
(TX-RX) = 0:TX-RX_1 = 0, andRX_2 = 0. All transmitted packets are correctly received, and there is no duplication introduced by the DUT.TX-RX_1 = d, butRX_2 = d. Some transmitted packets are not received but the duplications by DUT cancels out the difference, where d is positive.
(TX-RX) < 0:TX-RX_1 = 0,RX_2 > 0. There is duplication from the DUT.TX-RX_1 = d,RX_2 > d. Duplication from the DUT is large than the lost, where d is positive
Lost Packets
Given that RX can consist of two parts as mentioned above, we cannot be certain about the TX-RX_1. Consequently, we need use the sequence numbers in the packets to calculate “the holes in the sequence”. For example, when the TX sends #0,#1,#2,#3,#4,#5,#6, but #3 is not received by the RX, then TX-RX_1 = 1. But if #3 is not truly lost but is delayed by the DUT and later received by the RX, the TX-RX_1 will be back to 0.
TX: #0,#1,#2,#3,#4,#5,#6 RX: #0,#1,#2,#4,#5,#6 (Lost Packets = 1) (after a while…) RX: #3 (Lost Packets = 0)
Unfortunately, there is no one mechanism that can handle both scenarios at the moment.
Note
BER = ErroredBitsReceived / TotalBitsTransferred
= DroppedFrames * ErroredBitsPerDroppedFrame / TotalFramesTransferred * BitsPerTransferredFrame
= DroppedFrames * ErroredBitsPerDroppedFrame / (RxFrames + DroppedFrames) * BitsPerTransferredFrame
Let ErroredBitsPerDroppedFrame = e, and BitsPerTransferredFrame = b, and assume:
there is only one errored bit in a dropped frame = e = 1
received frames and dropped frames have the same bits per frame, b rx = b dropped = b =(8 * RxBytes)/RxFrames
Then, BER = DroppedFrames * RxFrames /(8 * RxBytes) * (RxFrames + DroppedFrames)
5.7.3. Latency and Jitter
The Latency and Jitter section show the latency and jitter values calculated for each end-to-end stream entity. The mechanism for showing TID conflicts explained above is also used here.
Jitter measurement is only available for TPLD ID < 32, as shown in the screenshot below.
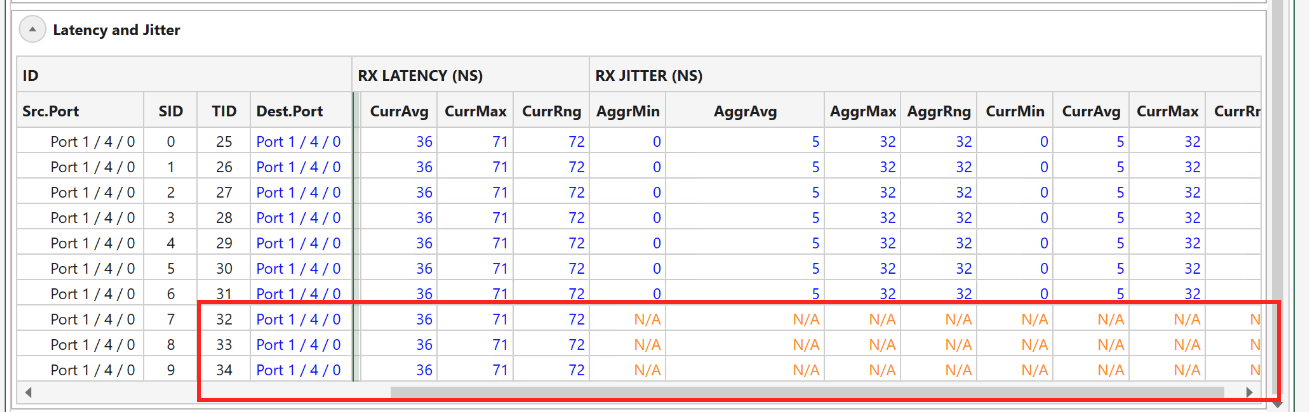
Fig. 5.130 Jitter measurement is only available for TPLD ID < 32.