5.10. Histograms
This section describes the XenaManager Histogram panel. The panel allow you to configure the histogram settings for the currently selected port and to inspect the result of the histograms data collection.
5.10.1. Overview
Histograms analyze a stream of packets, either at the transmit side or the receive side of a port, and classify them into a number of buckets, counting how many packets go into each bucket.
A histogram is configured with a fixed number of buckets and a value range. The first and last bucket handles all the packets that don’t fit within the specified range. All the other buckets each handle a sub-span of the range, determined by the histogram configuration.
Histograms complement the statistics counters function, which just provide aggregate counts, and the capturing function, which provides per-packet information.
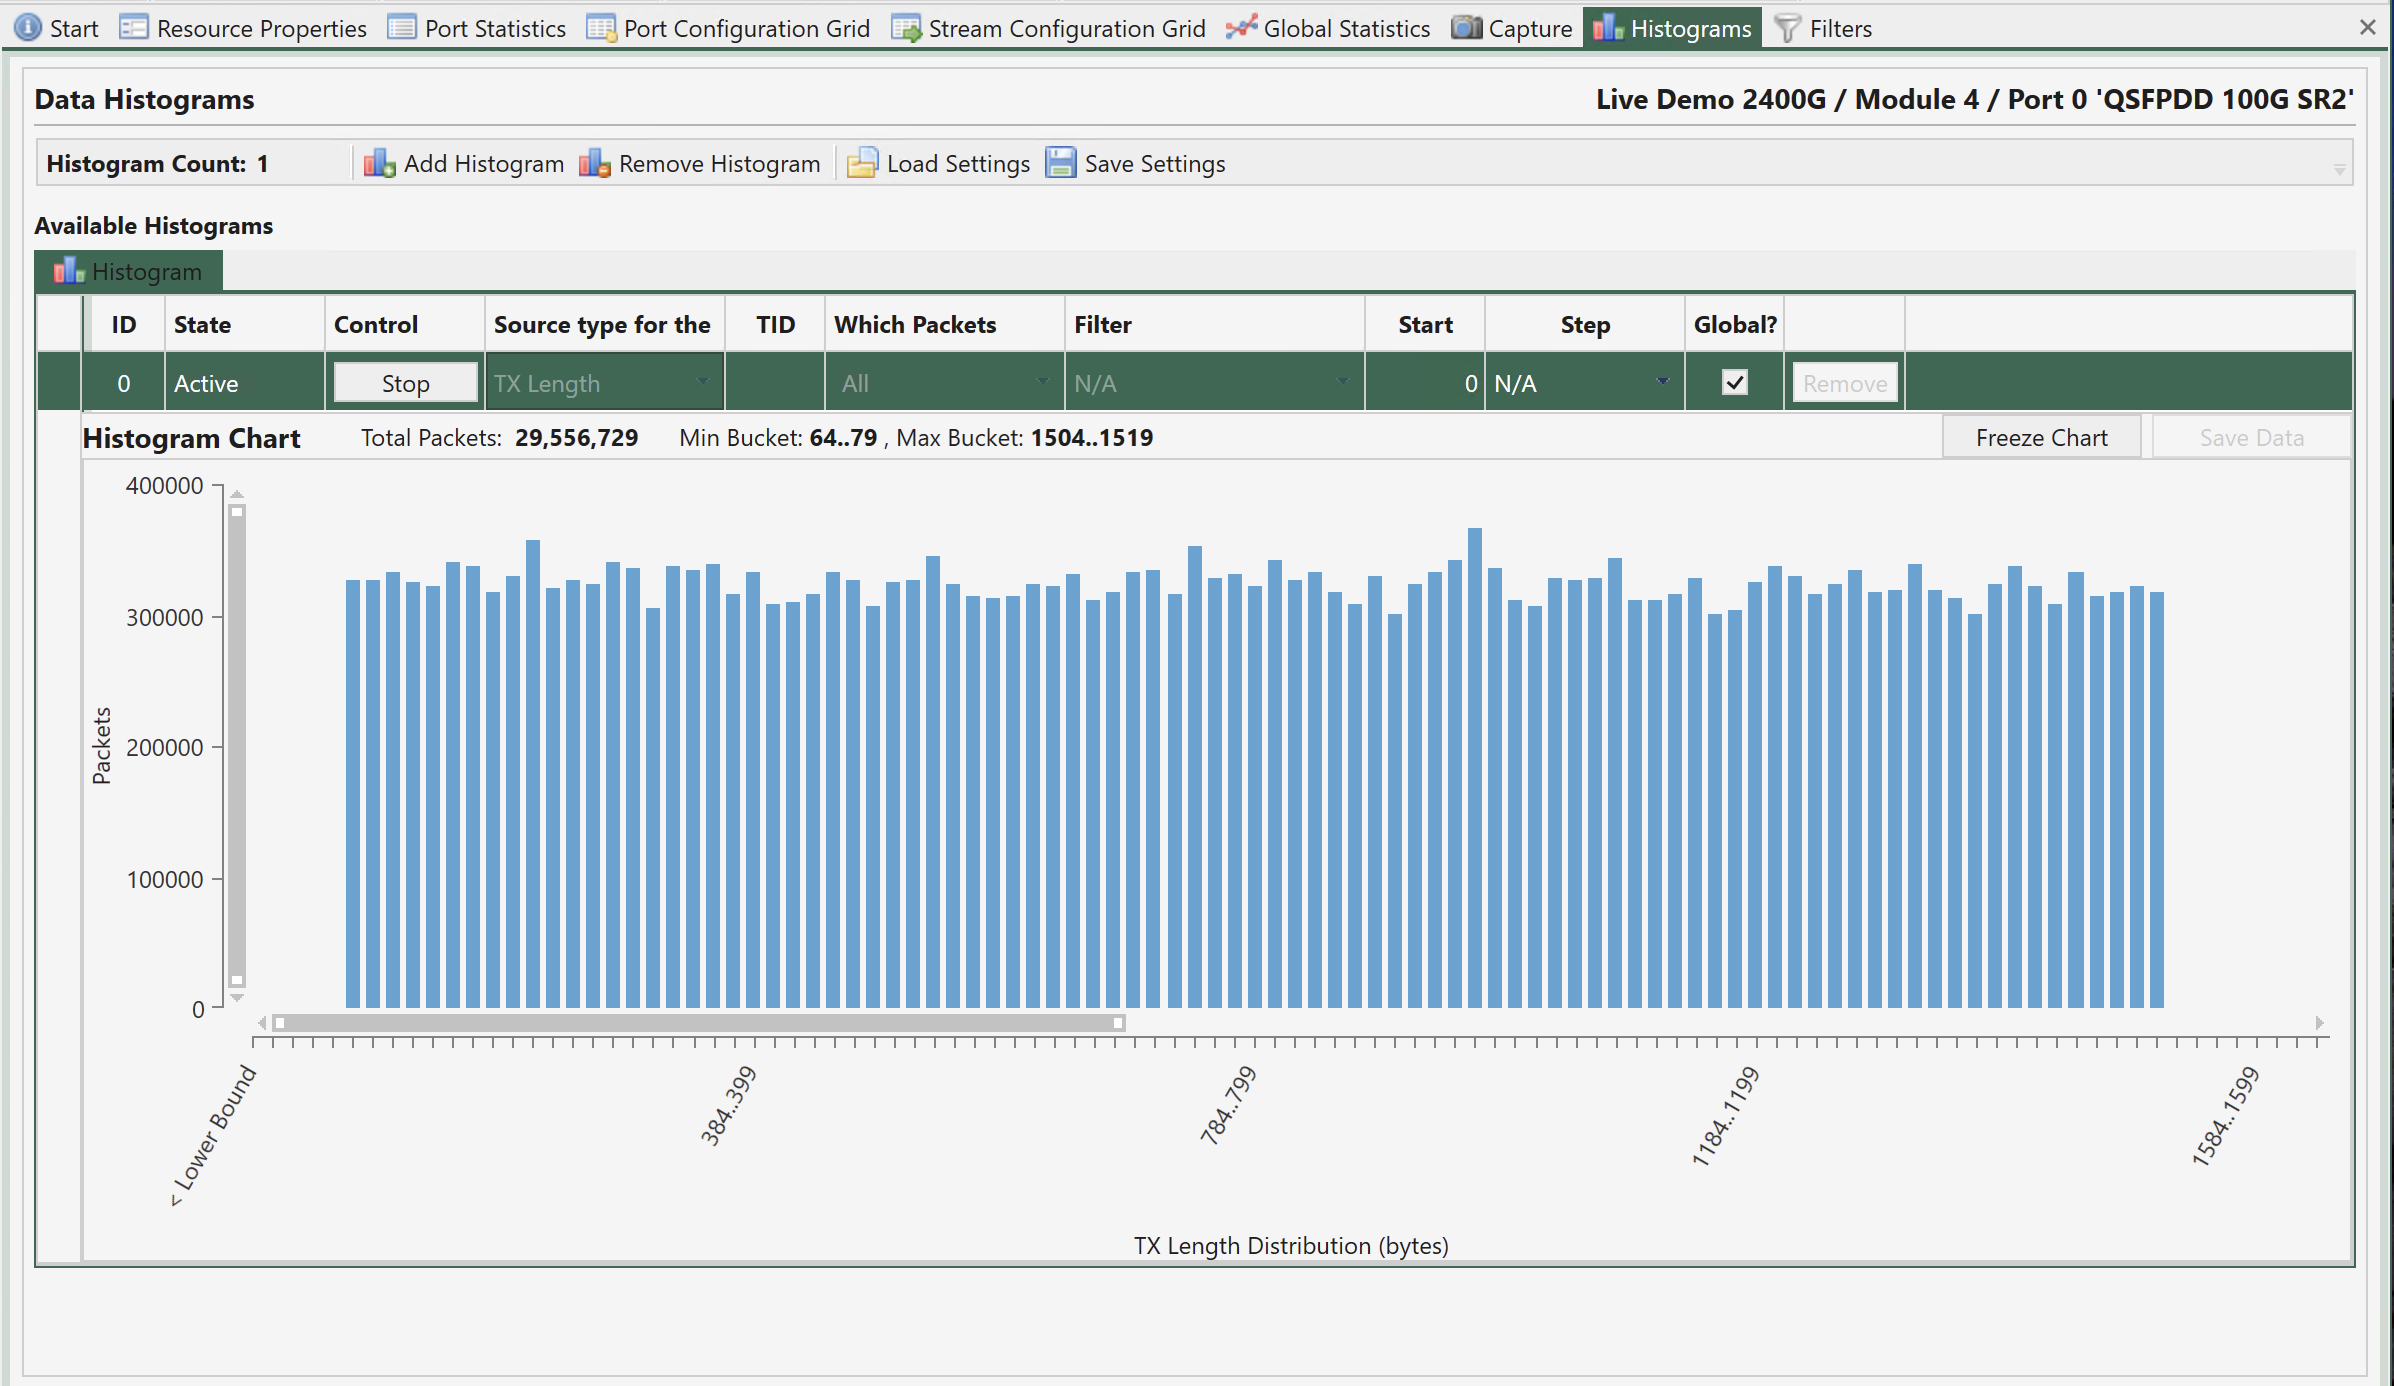
Fig. 5.133 Port histograms
5.10.2. Configuration
You can create up to two histograms per port. Usually a single histogram will be sufficient for most uses. You can add a new histogram by pressing the Add Histogram button in the toolbar. To delete a histogram you should select the histogram and press the Remove Histogram button in the toolbar.
Each histogram is listed as a row in the configuration grid view and has the following configuration properties:
State: Indicates whether the histogram is currently activated or not.
Control: Allow you to control the activation state of the histogram.
Global?: Allow histogram control from Global Statistics view.
Source Type: Determines what type of metric is used as the source for the histogram.
Which Packets: Control which type of packets are used for the histogram.
TID: If the Which Packets property is set to Test Payload this field should contain the Test Payload ID (TID).
Filter: If the Which Packets property is set to Filter you should select the filter you want to use here.
Start: The lowest value in the valid range. Any value lower than this will be placed in the first bucket.
Step: The span of each bucket.
5.10.3. Histogram Results
Viewing Charts
Once a histogram is active you can view the realtime chart of the collected data by selecting the histogram row. When a histogram is activated all the buckets are empty. As packets are encountered (according to the source) their data is registered and placed in the correct bucket according to the range specification. You can see this progress in the chart.
Hovering the mouse over a particular vertical bar pops up a little window with the information about that bucket as shown in the image below. The Accumulated value indicates the sum of the values up to and including the value in focus.
You can temporarily freeze the chart update by pressing the Freeze Chart button. No data will be lost and when you unfreeze the chart it will be updated with all the samples that was collected in the background.
You can use the chart scrollbars to zoom and pan the results as described here.
Saving Results
The bucket counts can also be saved to a CSV text file file for more detailed analysis by pressing the Save Data button.