5.11. Gauge/Meter
This section describes the XenaManager Gauge/Meter window. The window allows you to display the layer-2 traffic rate of a port or a stream in a Gauge (or Meter).
5.11.1. Overview
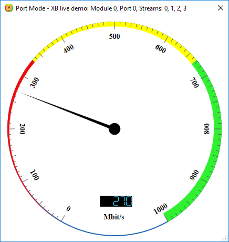
Gauges display the current layer-2 traffic in bit/s for a port or a stream for a quick visual overview of one or more traffic results. The gauge transforms the layer-2 traffic into the visual representation of the gauge and will display the numerical value in the same window. The gauge auto scales to the bit rate of the port carrying the monitored traffic.
5.11.2. Configuration
You can activate gauges when traffic is running. To activate a gauge for a port or a stream, right-click on the port or stream in the Available Resources tree in the left side of the XenaManager. You now get a menu with options for the port/stream, including Add Gauge. When you click Add Gauge, the gauge window will appear. You can continue to add more gauges to show information for the ports and streams that are relevant to you.
At the top of the gauge window you can see if the gauge shows traffic for a port (Port Mode) or a stream (Stream Mode). You will also find identification of chassis, module, port and stream(s). If you left-click and hold on the top line in the gauge window, you can move it around on your PC screen.
You can resize the gauge window by dragging in the low right corner of the window.

Fig. 5.117 Port gauge/meter
Keyboard Resizing Shortcuts:
+: Doubles the gauge window size.
-: Restores the gauge window size.
