Medium#
TX Taps#
This sub-tab allows users to manually control and monitor the equalizer settings of the individual SerDes in the transmission direction (towards the transceiver cage). The affected SerDes is selected using the SerDes Index. This feature can, for example, be used to improve the signal quality over a directly attached copper cable (e.g. CR4) in the absence of automatic TX tuning auto-negotiation or to test a transceiver using various TX equalization settings.
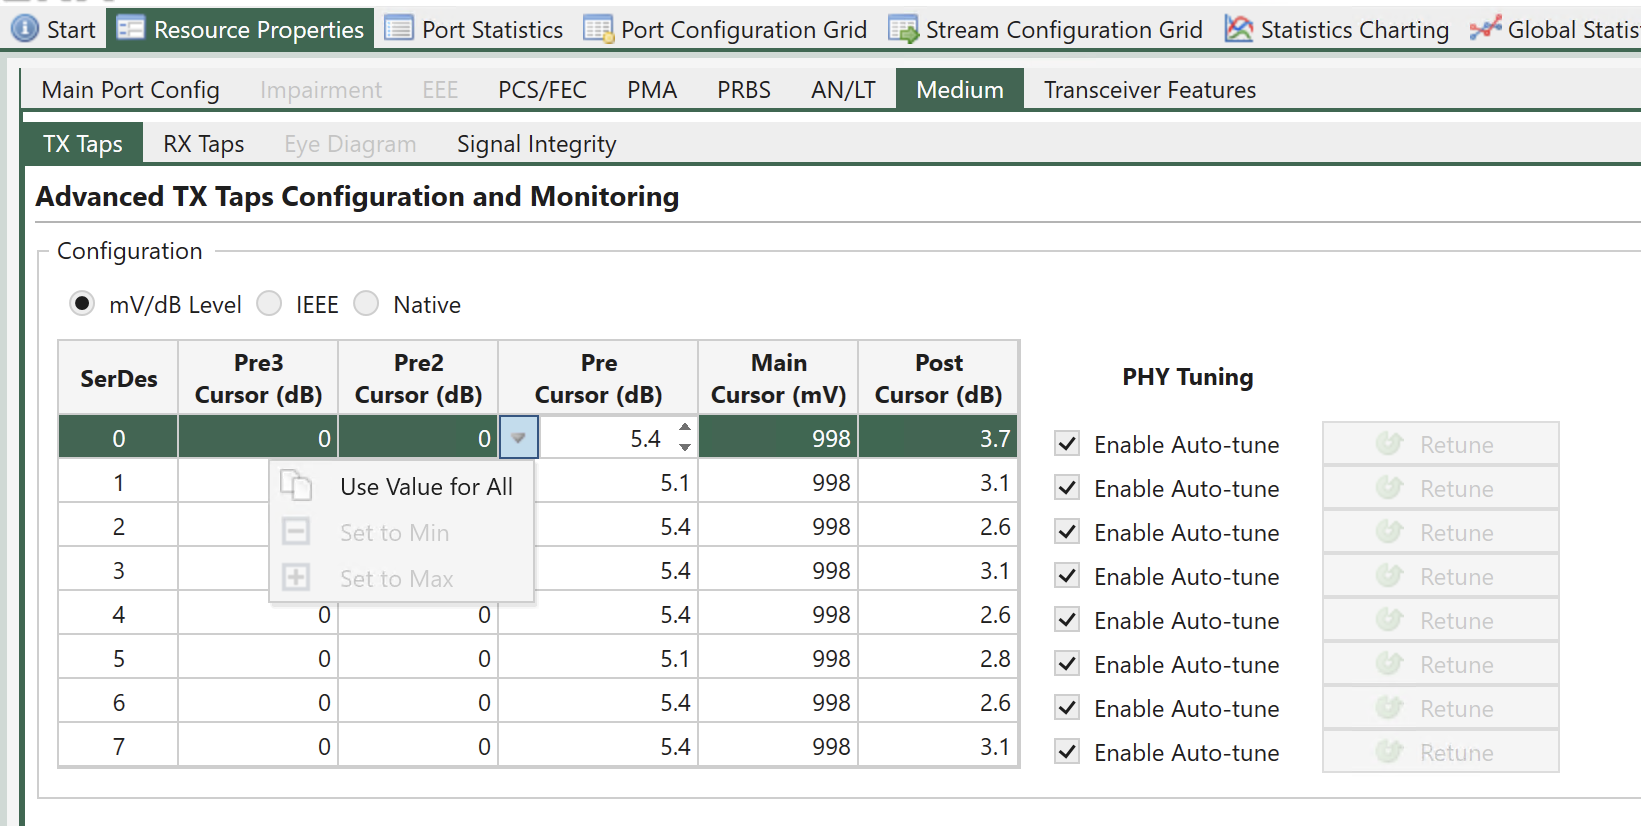
Fig. 95 Port Properties - TX Taps (mV/dB Level, available on Freya module)#
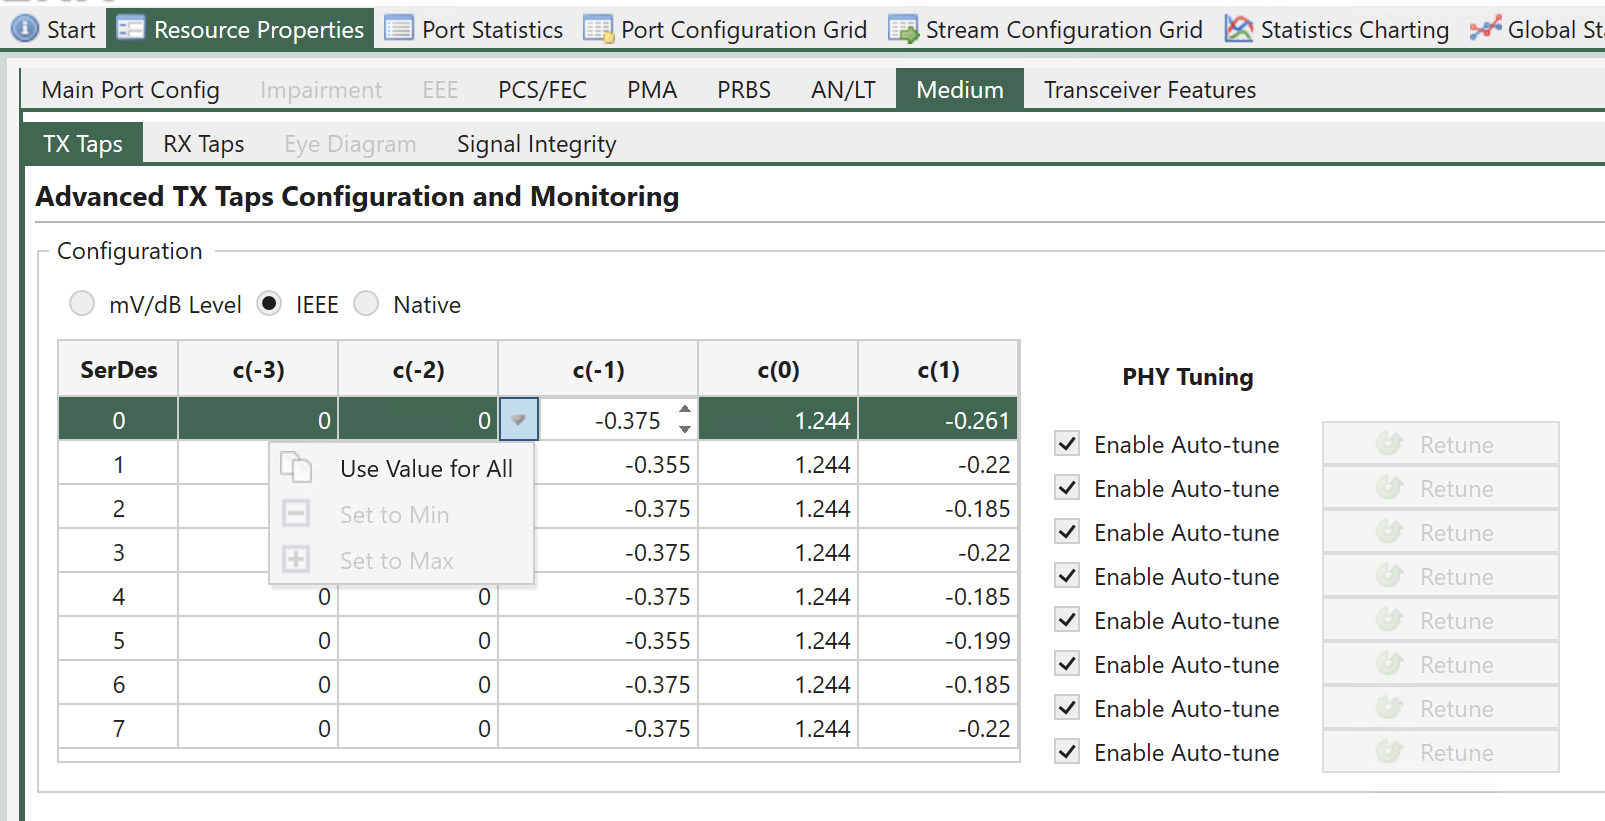
Fig. 96 Port Properties - TX Taps (IEEE Coefficient, available on Freya module)#
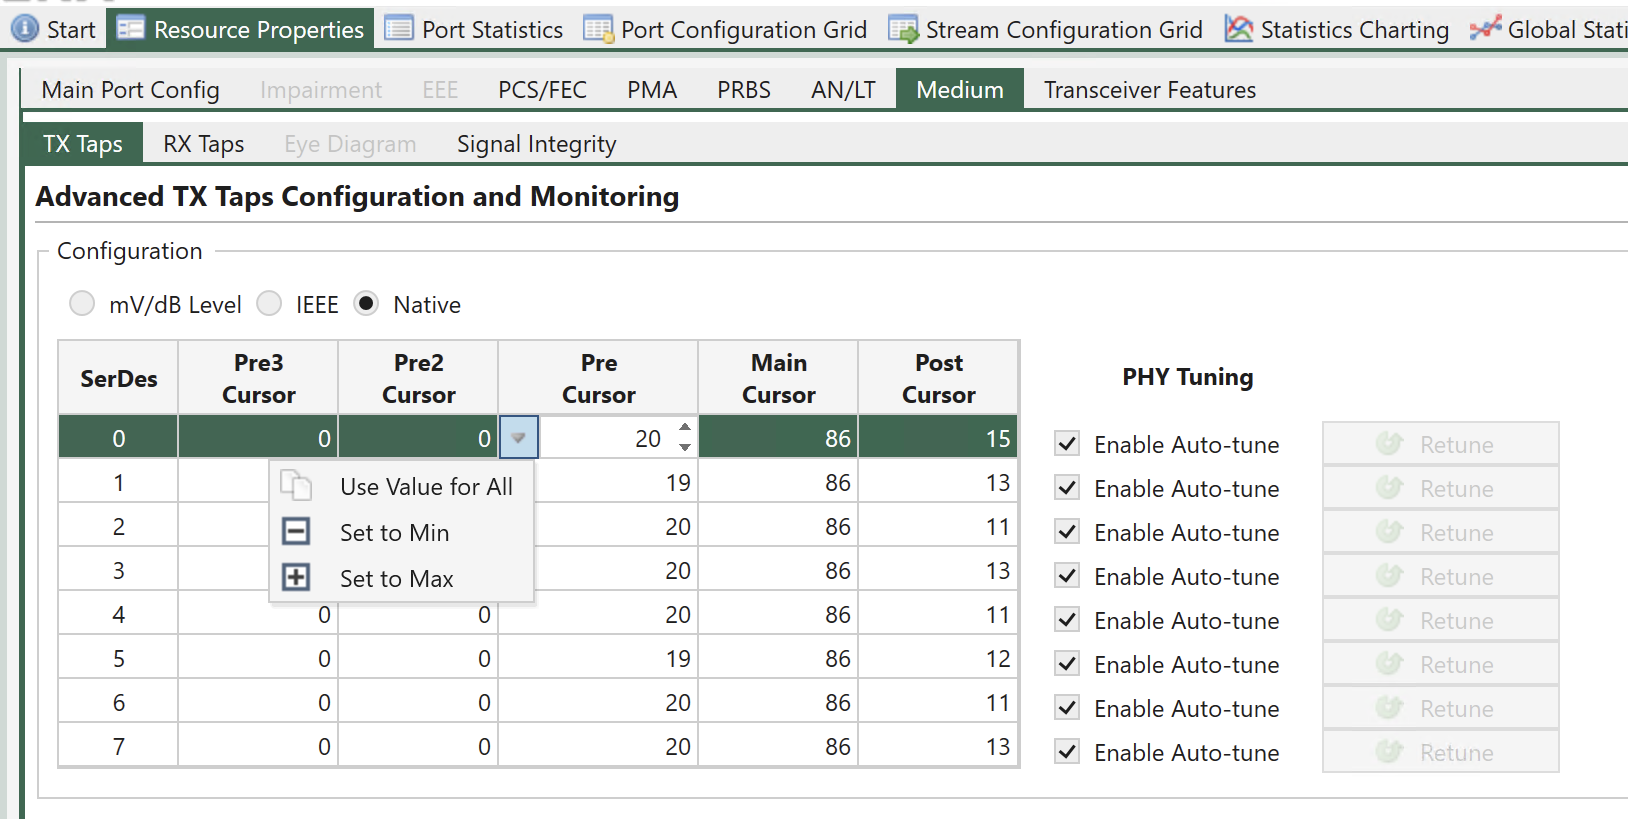
Fig. 97 Port Properties - TX Taps (Native Value)#
Note
The values of the equalizer parameters to be used depends on the port type.
Important
mV/dB Level and IEEE views are only available on Freya modules
Enable Auto-adjust and Retune allows the user to control the tuning in the TX and RX direction: The user can enable or disable the automatic retuning, which is performed on the interfaces as soon as a signal is detected by the transceiver. This is useful if a bad signal causes the PHY to continuously retune or if for some other reason it is preferable to use manual retuning. Regardless of whether the automatic tuning is enabled, the user may also trigger a manual retuning.
RX Taps#
Some modules only have one RX CTLE parameter, where-as some instead have a high band and low band frequency equalizer. Depending on module the available options will be made configurable.
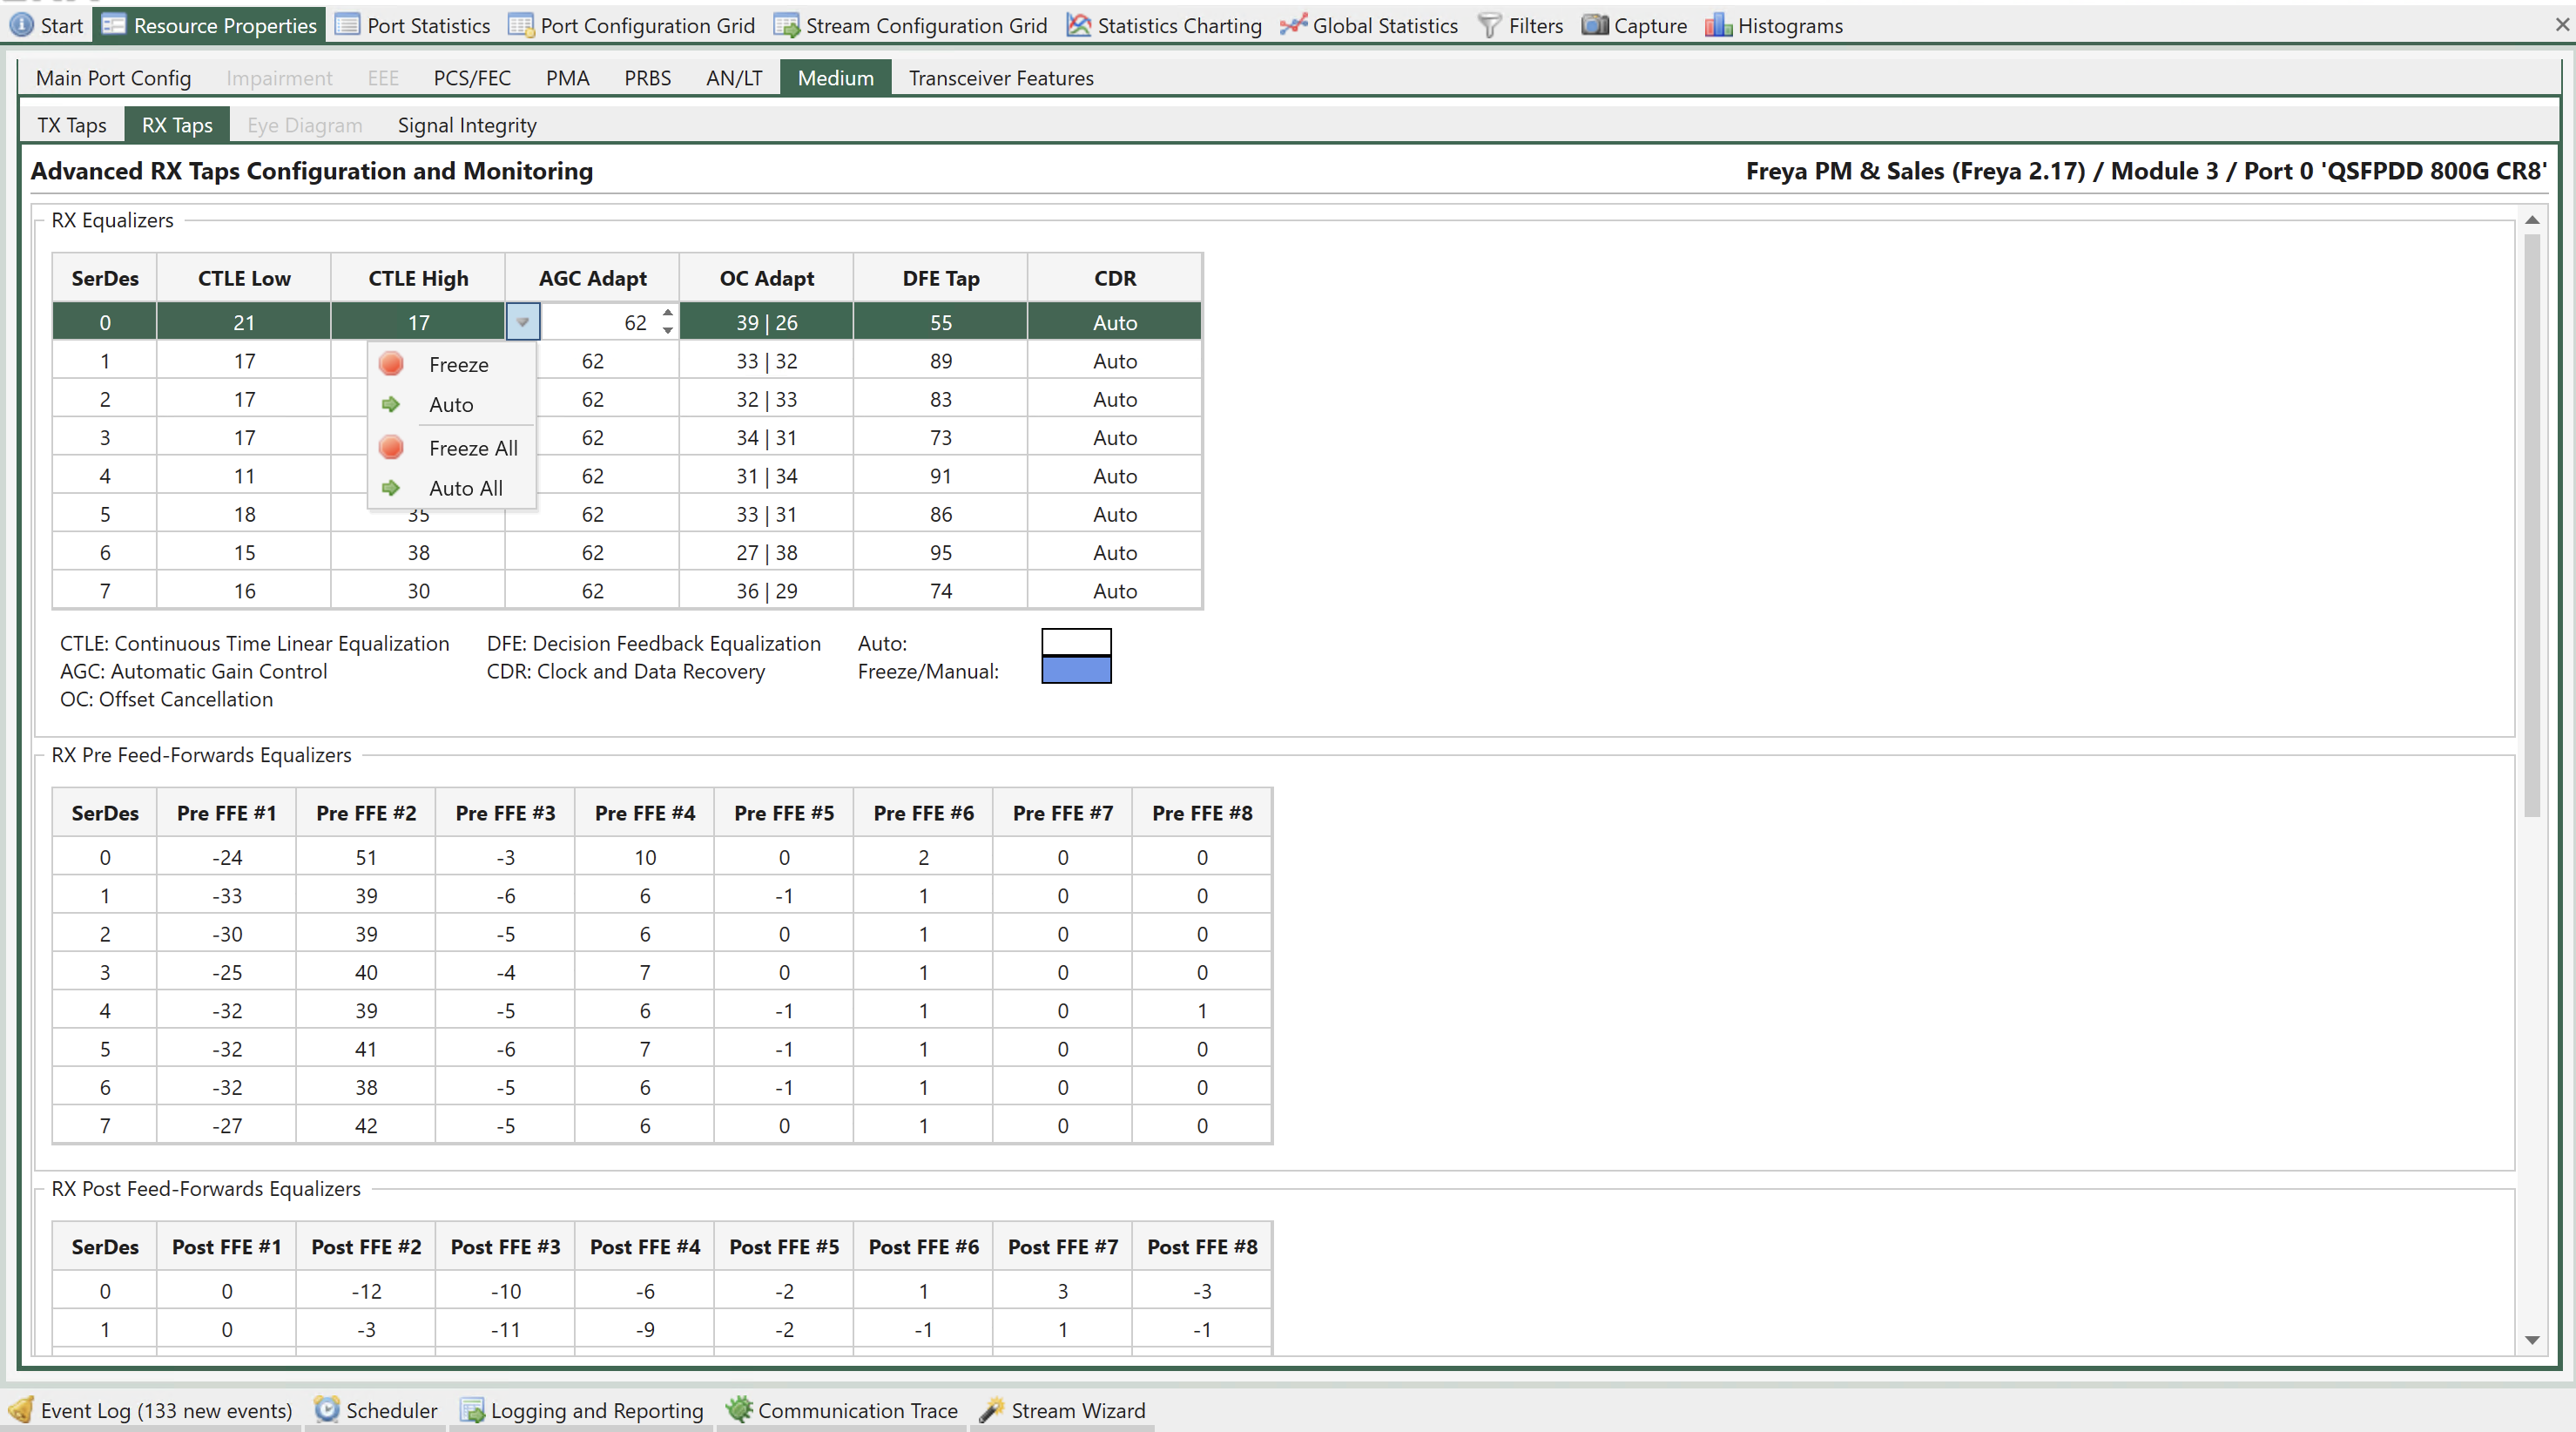
Fig. 98 Port Properties - RX Taps (available on Freya module)#
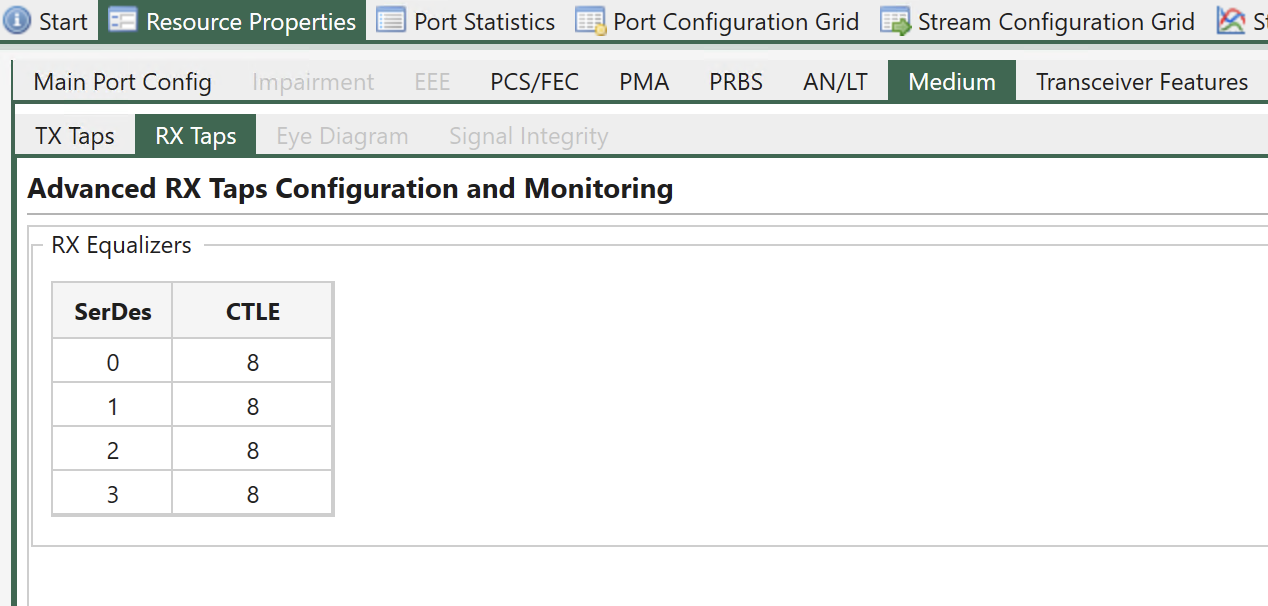
Fig. 99 Port Properties - RX Taps (available on Thor module)#
Eye Diagram#
Some ports support a bit-error-rate (BER) eye diagram. If the eye diagram is supported, a third section Eye Diagram is added to the Medium` configuration section as shown in Fig. 100.
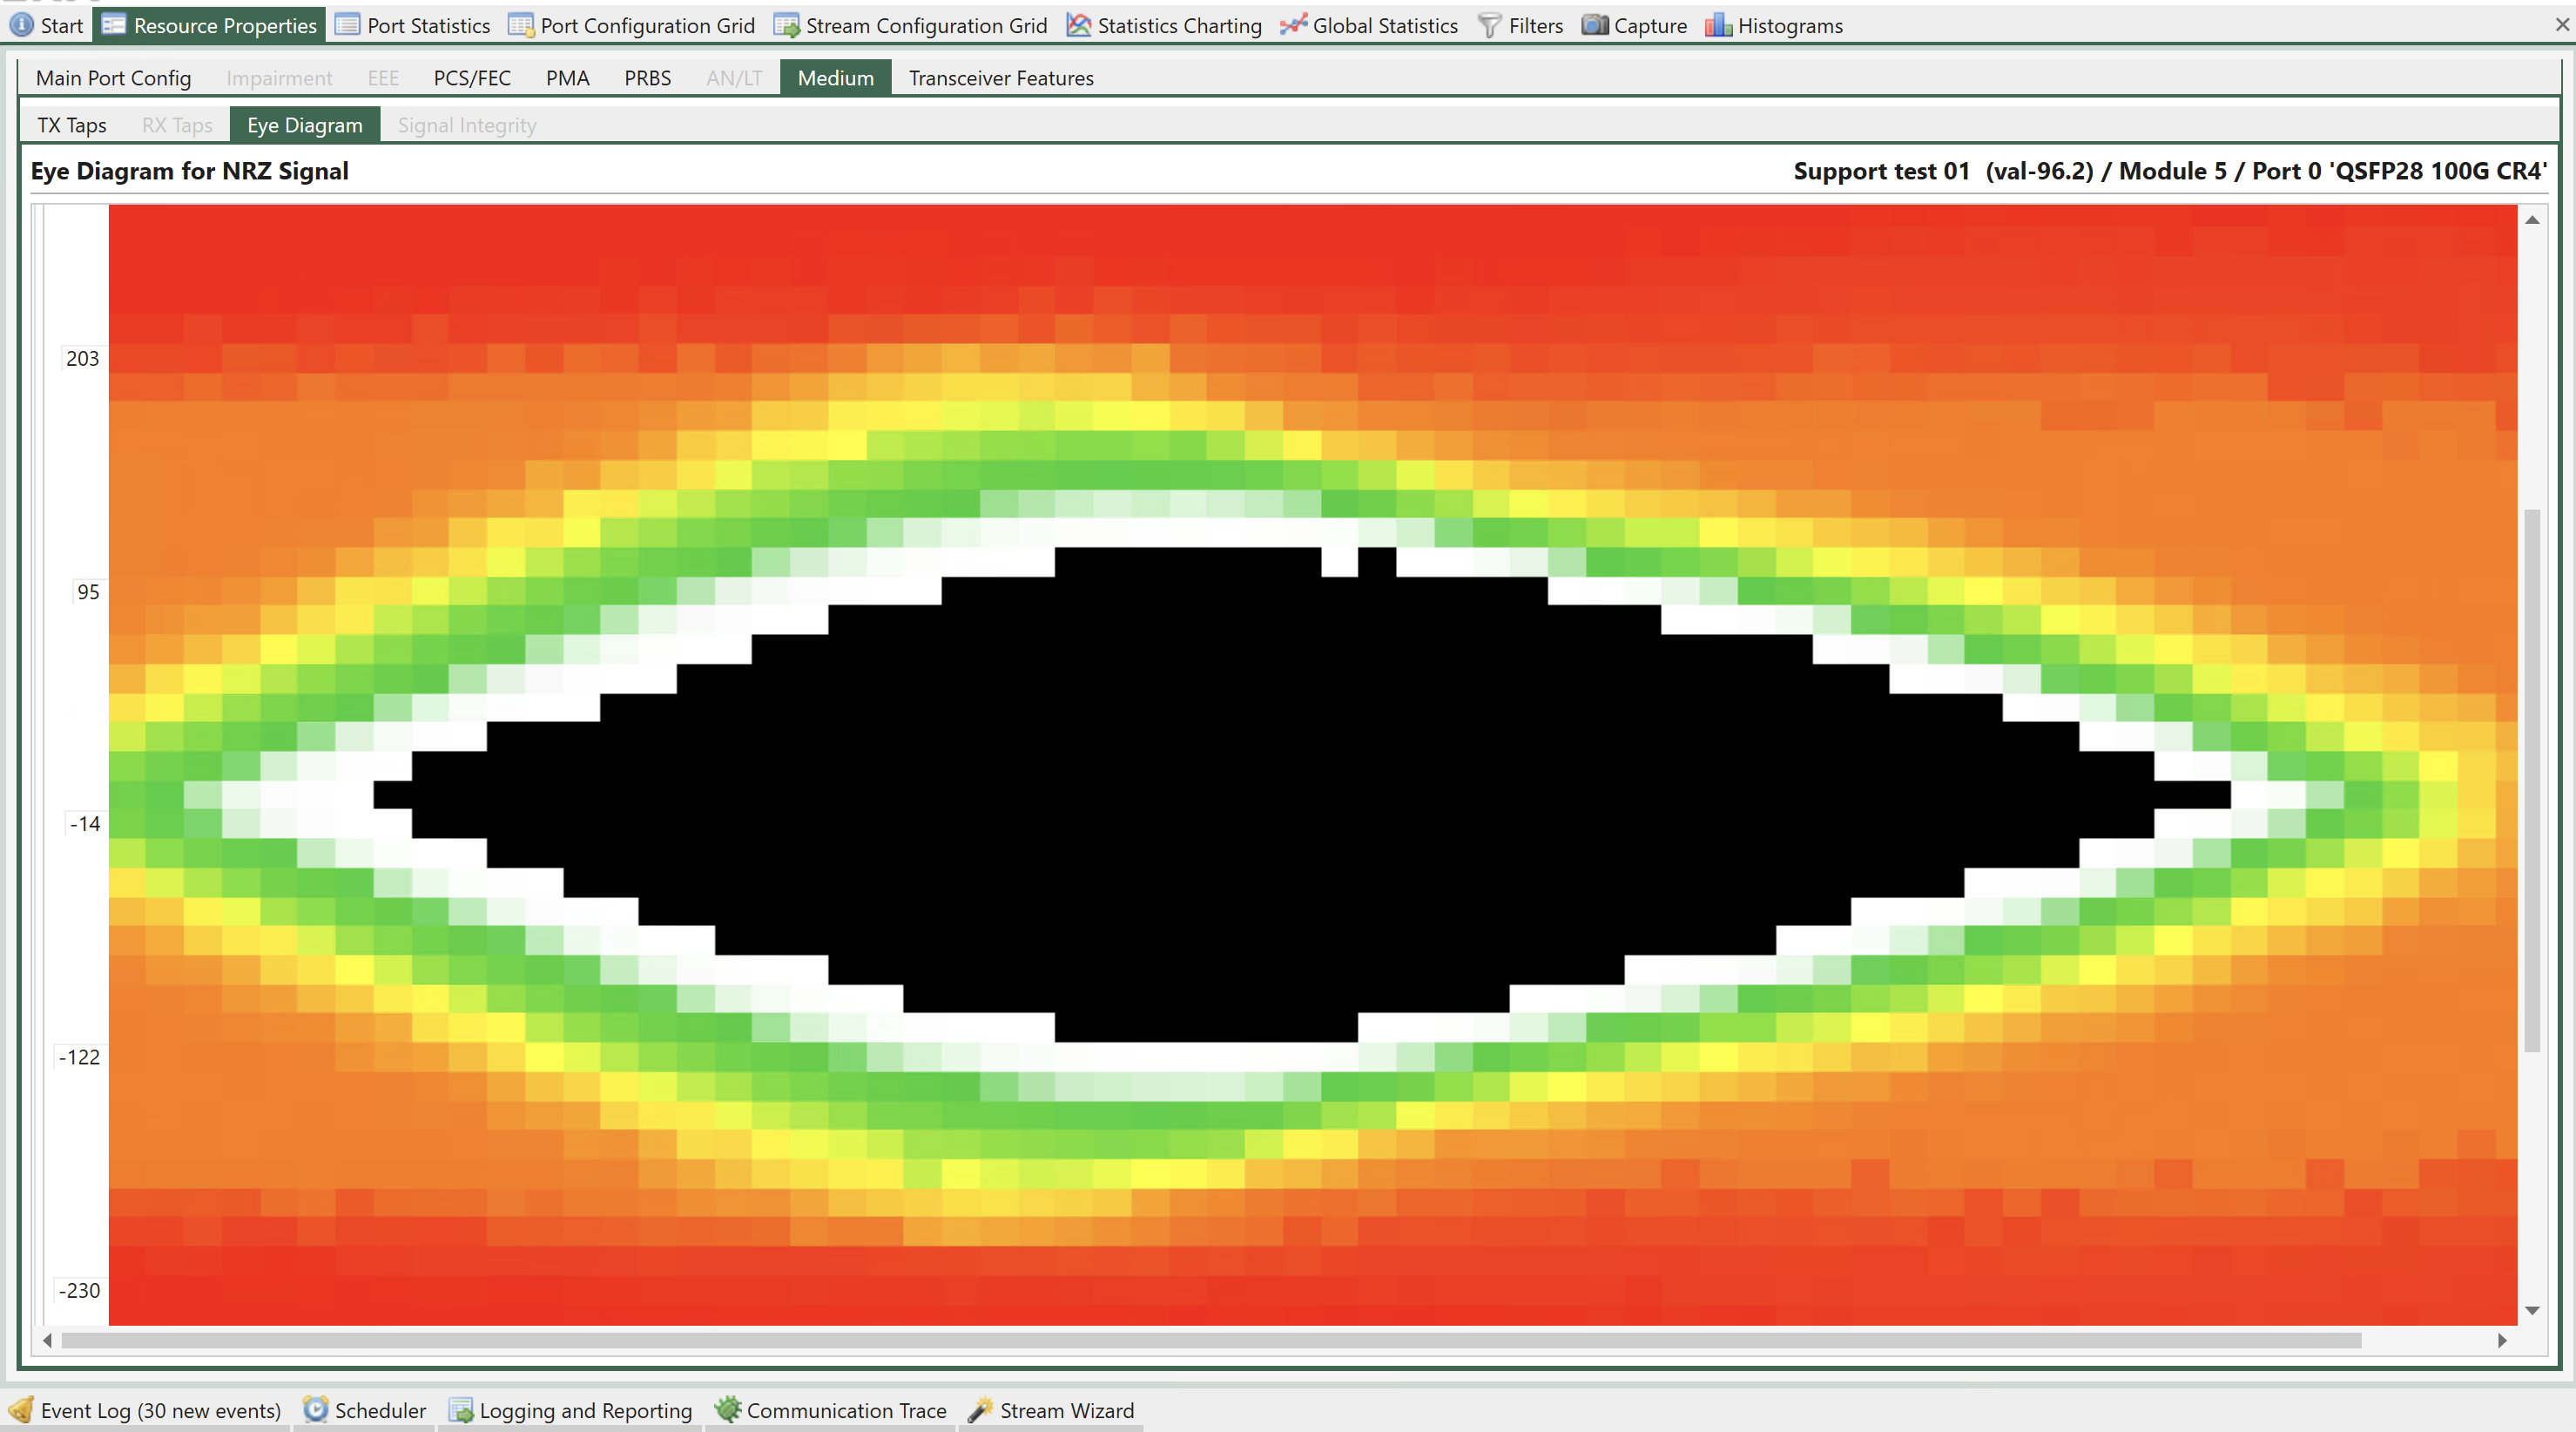
Fig. 100 Port Properties - Eye diagram (available on Loki module)#
The bit-error-rate (BER) eye diagram allows the user to get a direct visual representation of the signal quality. The eye diagram is formed by changing the sampling point of the PHY step by step in the time dimension (sampling delay) and the amplitude dimension (0/1 threshold). For each sampling point (x,y), 1 million bits are measured and the number of bit-errors is counted. A simple division gives the BER. The result is the BER eye diagram shown above.
The color map shows the measured bit-error-rate for each point going from 1 million (maximum red) to zero (black). The color scale is logarithmic. Higher resolutions give a more clear diagram and higher values of X and Y will also give a higher precision in the vertical and horizontal bathtub curve estimations, respectively (see Eye Data below). However, the time it takes to measure the eye is directly proportional to the number of sampling points (X*Y).
Diagram Control#
This section controls the collection of the BER eye diagram and eye data as well as the parameters associated with this measurement.
Property |
Explanation |
|---|---|
Collection state |
Shows the current state of the eye diagram measurement. |
Start/Stop Collection |
Start/Stop eye diagram measurement. |
Refresh Data |
Re-read current eye diagram and eye data measurement from the chassis. Press this to view the current eye measurement for the SerDes if one already exists. |
Generate Report |
Generates a pdf report of the eye diagram. The report is stored in the following folder: |
X Resolution |
Resolution of the time-axis (horizontal). Calculated from X Exponent as |
Y Resolution |
Resolution of the voltage axis (vertical). Calculated from Y Exponent as |
X Exponent |
User-settable X resolution exponent. Min/Max = 3 / 6. |
Y Exponent |
User-settable Y resolution exponent. Min/Max = 3 / 8. |
SerDes Index |
The SerDes for which the settings and controls listed above, as well as the Per SerDes TX PHY Tuning listed below applies. Valid values = 0..3. |
Note
Note that higher values of X and Y will give you a higher precision in the vertical and horizontal bathtub curve estimations, respectively. However, the time it takes to measure the eye is directly proportional to the number of sampling points (X*Y).
Eye Data#
The eye data table provides an estimate of several parameters of the eye, including width, height, and jitter. Future releases will also include link BER estimates based on the horizontal and vertical bathtub curves.
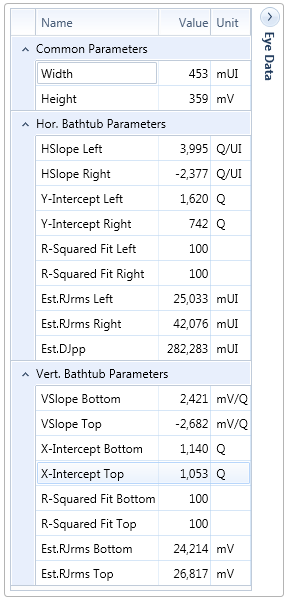
Fig. 101 Eye data#
Name |
Description |
|---|---|
Width |
Estimated eye-width in mUI |
Height |
Estimated eye-height in mV |
HSlope left |
Left slope of the horizontal bathtub curve |
HSlope right |
Right slope of the horizontal bathtub curve |
Y-intercept left |
Intersection with the Y-axis on the left side |
Y-intercept right |
Intersection with the Y-axis on the right side |
R-squared fit left |
Quality assessment of the estimation. Max = 100. |
R-squared fit right |
Quality assessment of the estimation. Max = 100. |
Est RJrms left |
Estimated random jitter (rms) - left side |
Est RJrms right |
Estimated random jitter (rms) - right side |
Est DJpp |
Estimated deterministic jitter |
VSlope bottom |
Bottom slope of the vertical bathtub curve |
VSlope top |
Top slope of the vertical bathtub curve |
X-intercept bottom |
Intersection with the bottom X-axis |
X-intercept top |
Intersection with the top X-axis |
R-squared fit bottom |
Quality assessment of the estimation. Max = 100. |
R-squared fit top |
Quality assessment of the estimation. Max = 100. |
Est RJrms bottom |
Estimated random jitter (rms) - bottom |
Est RJrms top |
Estimated random jitter (rms) - top |
Signal Integrity#
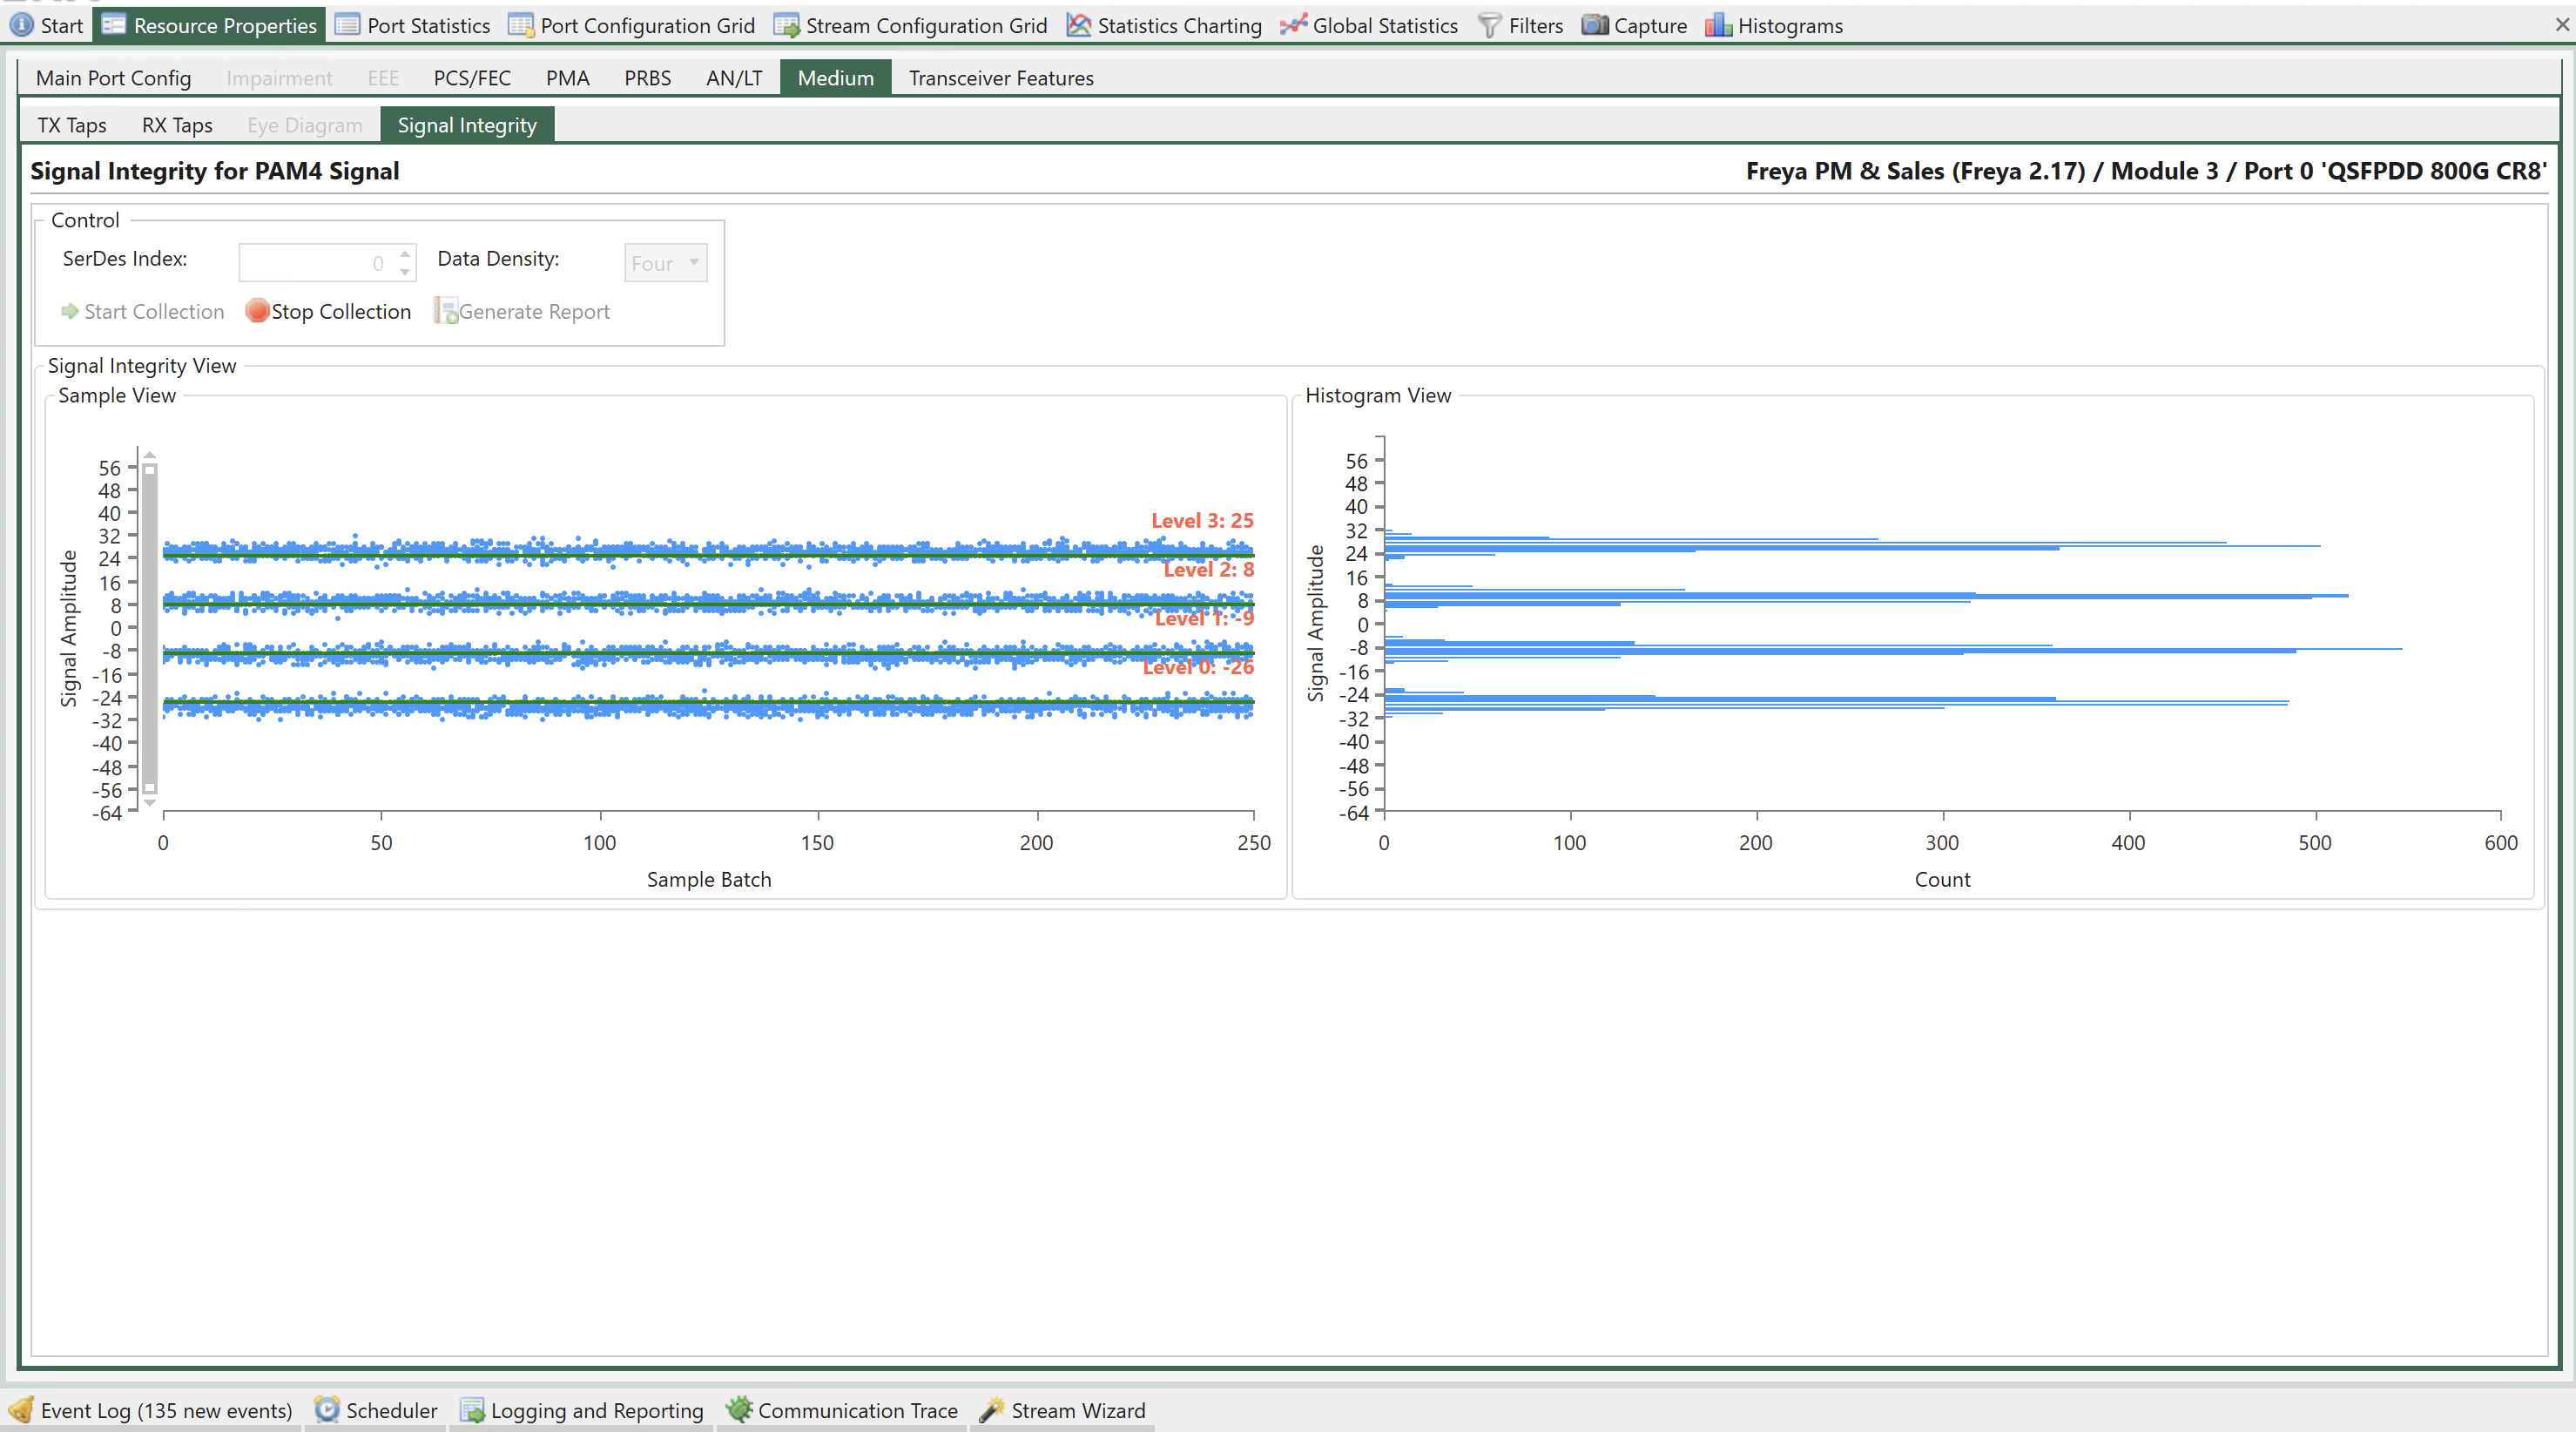
Fig. 102 Port Properties - Signal Integrity View (available on Freya module - L1/ANLT media mode)#
Signal Integrity View (SIV) can be found under . With SIV, you can easily analyze 112G PAM4 signal loss and noise impairments (other modulation and lane speeds will be supported in future releases).
When a signal is transmitted from one switch port to another, the signal is degraded by several factors. The signal level will be reduced due to the inherent resistance of the wires causing gradual loss of signal as the signal moves from the transmitter to the receiver. Limitations in the bandwidth will lead to Inter-Symbol Interference (ISI) and inductive coupling between electrical lanes as well as connectors lead to cross talk. Impedance mismatches cause reflections (Return Loss). At both the transmitter and receiver jitter can occur and finally the signal will be degraded by thermal noise.
Signal integrity is a measure of the quality of the transmitted signal. It is commonly analyzed using a so-called eye-diagram which is constructed by overlapping the pulses in a bit sequence as shown for an NRZ-modulated signal. The signals are sampled at the center of the pulses and if the voltage level is higher than Vref it is interpreted as a “1” and if it is below Vref a “0”.
With no distortion on the transmission the eye is nice and open. However, in a real system the eye will look more “closed”, where some of the “1”s will be mistaken as “0”s and thus lead to bit errors.
In general, impairments to the signal level such as loss and noise will cause the eye to “close” in the vertical direction whereas delay and jitter impairments will cause the eye to “close” in the horizontal direction
For 112 Gbps PAM4 modulated signals however, the situation is a bit more complicated. Since PAM4 has four levels, the eye diagram consists of three eyes rather than one. Obviously the PAM4 eyes are much narrower than the NRZ eye which means that PAM4 is less tolerant to distortions than NRZ.
For very high speeds like 112 Gbps the pre-FEC eye diagram is likely going to be almost closed and difficult to use for analyzing signal integrity. Instead, a vertical slicer eye diagram is used. The vertical slicer eye is constructed by plotting the sampled, recovered signal level for a large number of samples.
The sample view clearly shows the effects of signal loss and noise. The histogram view next to it shows the distribution shape of each slice, making it easier for you to tell the characteristics of each eye slice.
Property |
Explanation |
|---|---|
SerDes Index |
The index of the serdes lane you want to scan signal integrity. |
Data Density |
Controls the number of data samples to show on the UI. A higher density value gives you more data points on the view at the cost of higher computational resource used by the GUI application. |
Start Collection |
Start signal integrity data collection. |
Stop Collection |
Stop signal integrity data collection. |
Generate Report |
Generate a PDF report including the the sample view and histogram view. |
Sample View#
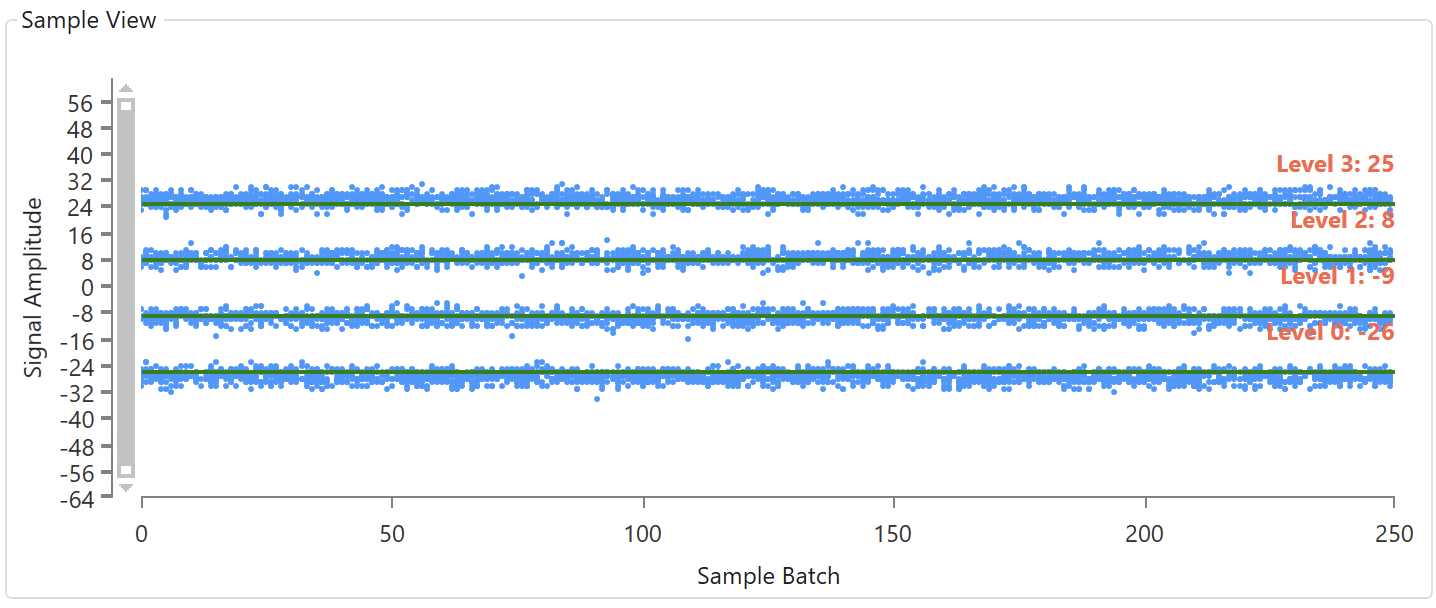
Fig. 103 Signal Integrity View - Sample View (available on Freya module - L1/ANLT media mode)#
For PAM4 signal, there are 4 levels, each of which indicates an amplitude level in PAM4. Ideally, if the PAM4 signal has no distortion, you should see 4 straight lines. As the PAM4 signal integrity degrades, you will see more scattered data points. The red text, i.e., Level 3, Level 2, Level 1, and Level 0 on the left show the average amplitude of each level.
The y-axis is a relative scale from -64 to 63. The x-axis is sample batch.
Histogram View#
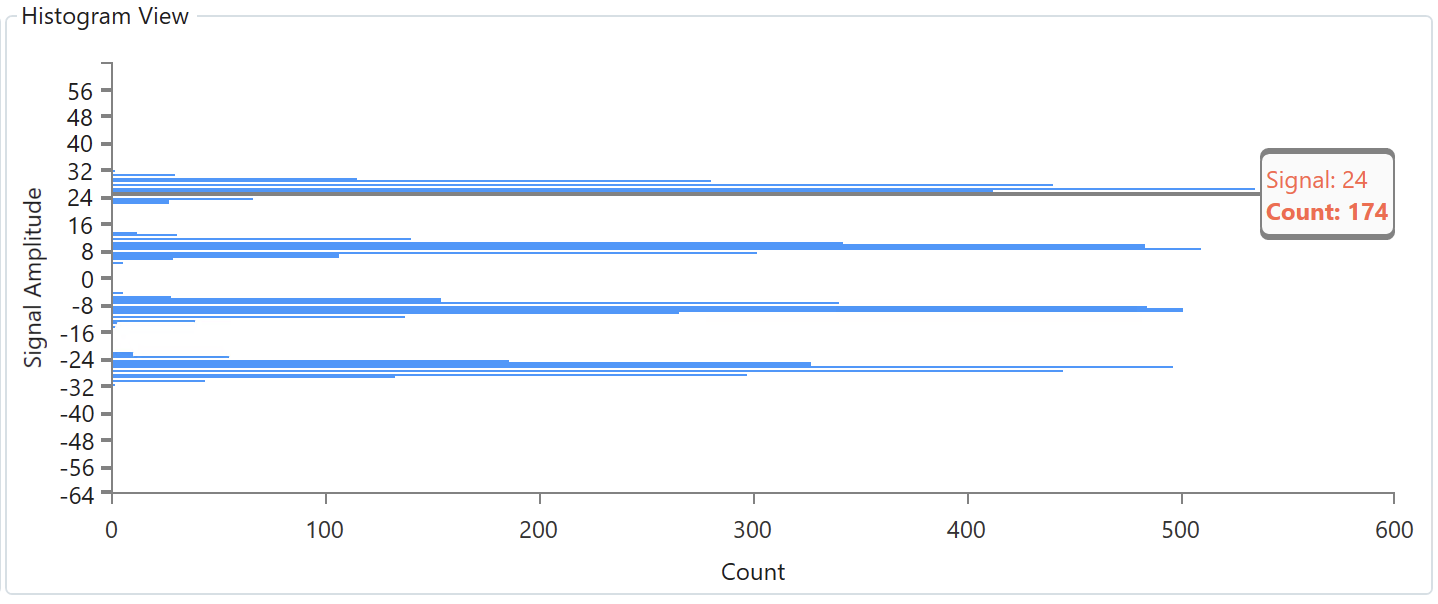
Fig. 104 Signal Integrity View - Histogram View (available on Freya module - L1/ANLT media mode)#
The histogram view shows the distribution of signal integrity data points. Ideally, if the PAM4 signal has no distortion, you should see 4 straight lines. As the PAM4 signal integrity degrades, the distribution diagrams become “wider and shorter”
The y-axis scale is the same as the sample view, from -64 to 63. The x-axis is the data point count.