3. Getting Started
3.1. Getting Started with Traffic Generation & Analysis
This section is designed to help you begin using XenaManager to set up a simple bi-directional layer-2 Ethernet switching test scenario.
3.1.1. Add Chassis
A testbed is essentially a set of ports that you are actively utilizing. Certain panels within XenaManager will exclusively display data for ports that are part of your ongoing testbed. This encompasses both the Port Configuration Grid, Stream Configuration Grid, as well as Global Statistics.
Press the Add Chassis button located to the left in the ribbon bar at the top of the application.
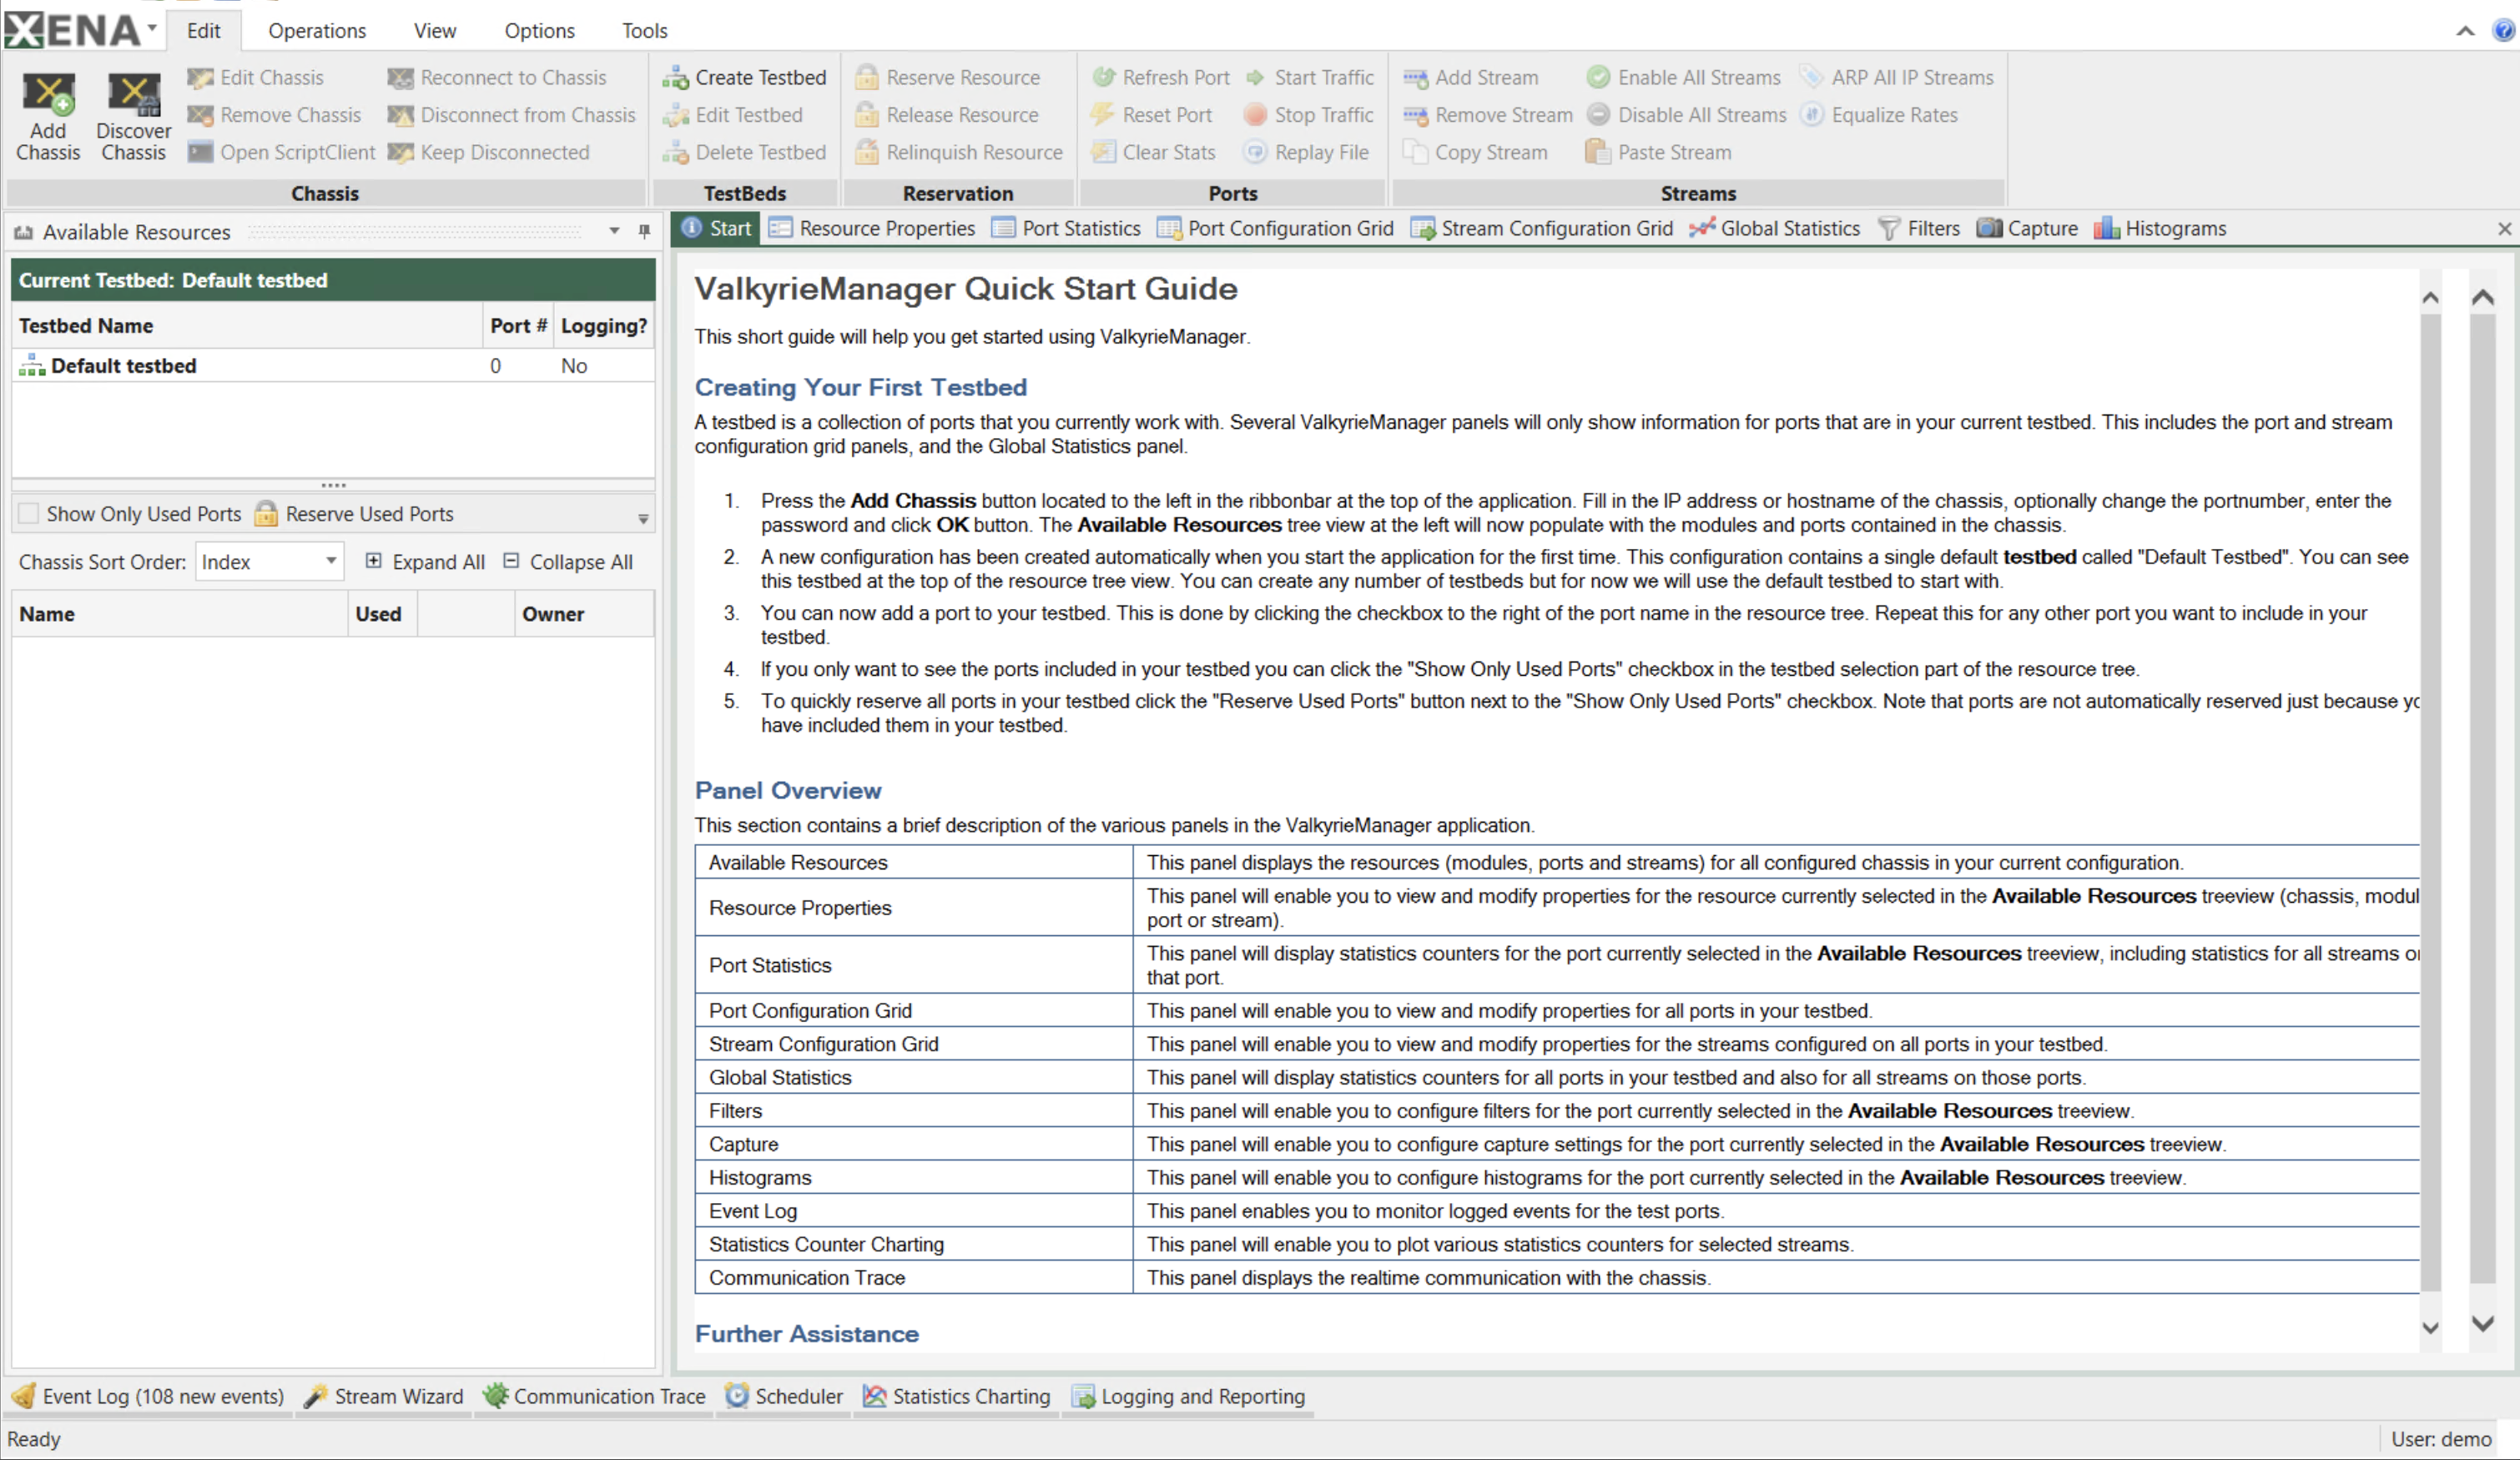
Fig. 3.1 Add chassis
Fill in the IP address or hostname of the chassis, optionally change the Chassis Port Number, enter the password (default is xena) and click OK button. The Available Resources tree view at the left will now populate with the modules and ports contained in the chassis.
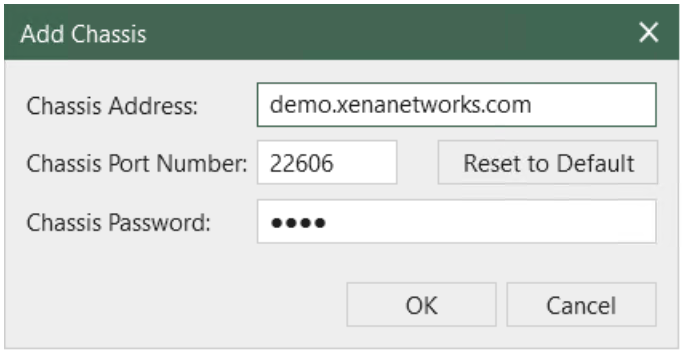
Fig. 3.2 Enter IP address, port number and password to add chassis
A new configuration has been created automatically when you start the application for the first time. This configuration contains a single default testbed called Default Testbed. You can see this testbed at the top of the resource tree view. You can create any number of testbeds but for now we will use the default testbed to start with.
Use to indicate who owns the port reservation.
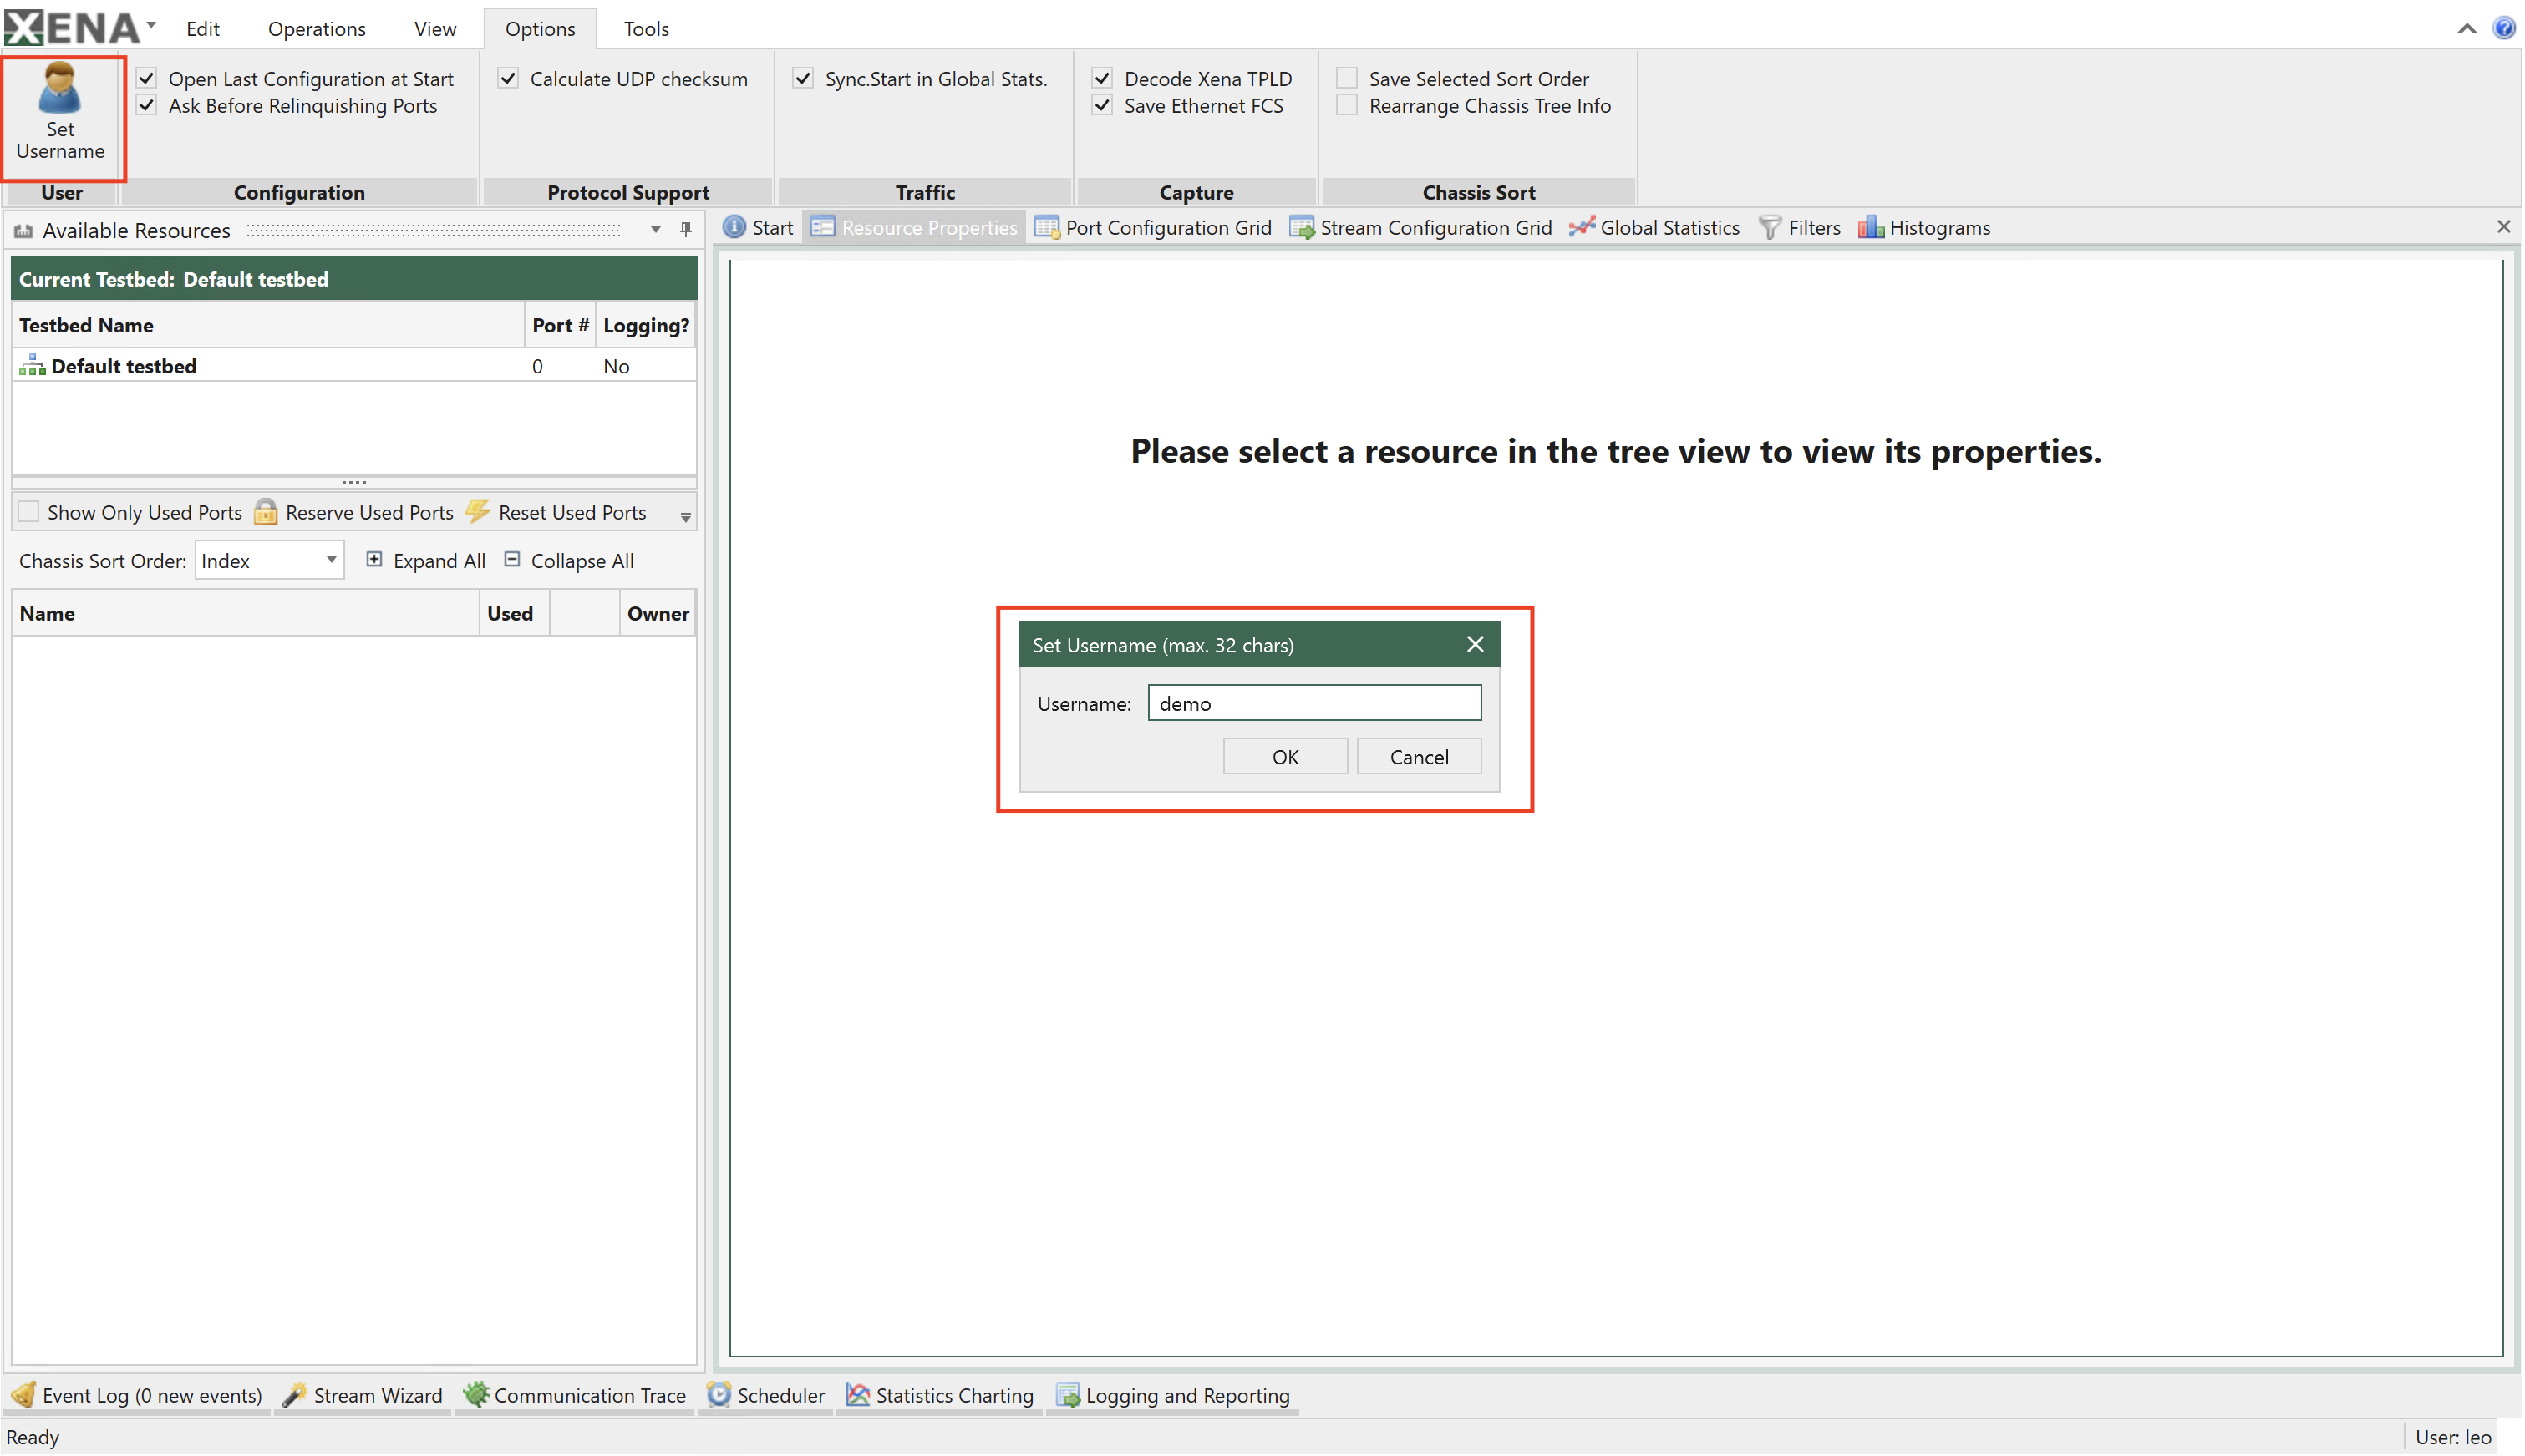
Fig. 3.3 Set username
5. You can now add ports to your testbed. This is done by clicking the checkbox in the Used column to the right of the port name in the resource tree. Add two ports to your testbed in this way. Please ensure that the two ports are connected through a standard layer-2 switch. 5. If you only want to see the ports included in your testbed you can click the Show Only Used Ports checkbox in the testbed selection part of the resource tree. 6. To quickly reserve all ports in your testbed click the Reserve Used Ports button next to the Show Only Used Ports checkbox.
3.1.2. Configure Module
Reserve a module, and go to to configure module media configuration and port configuration.
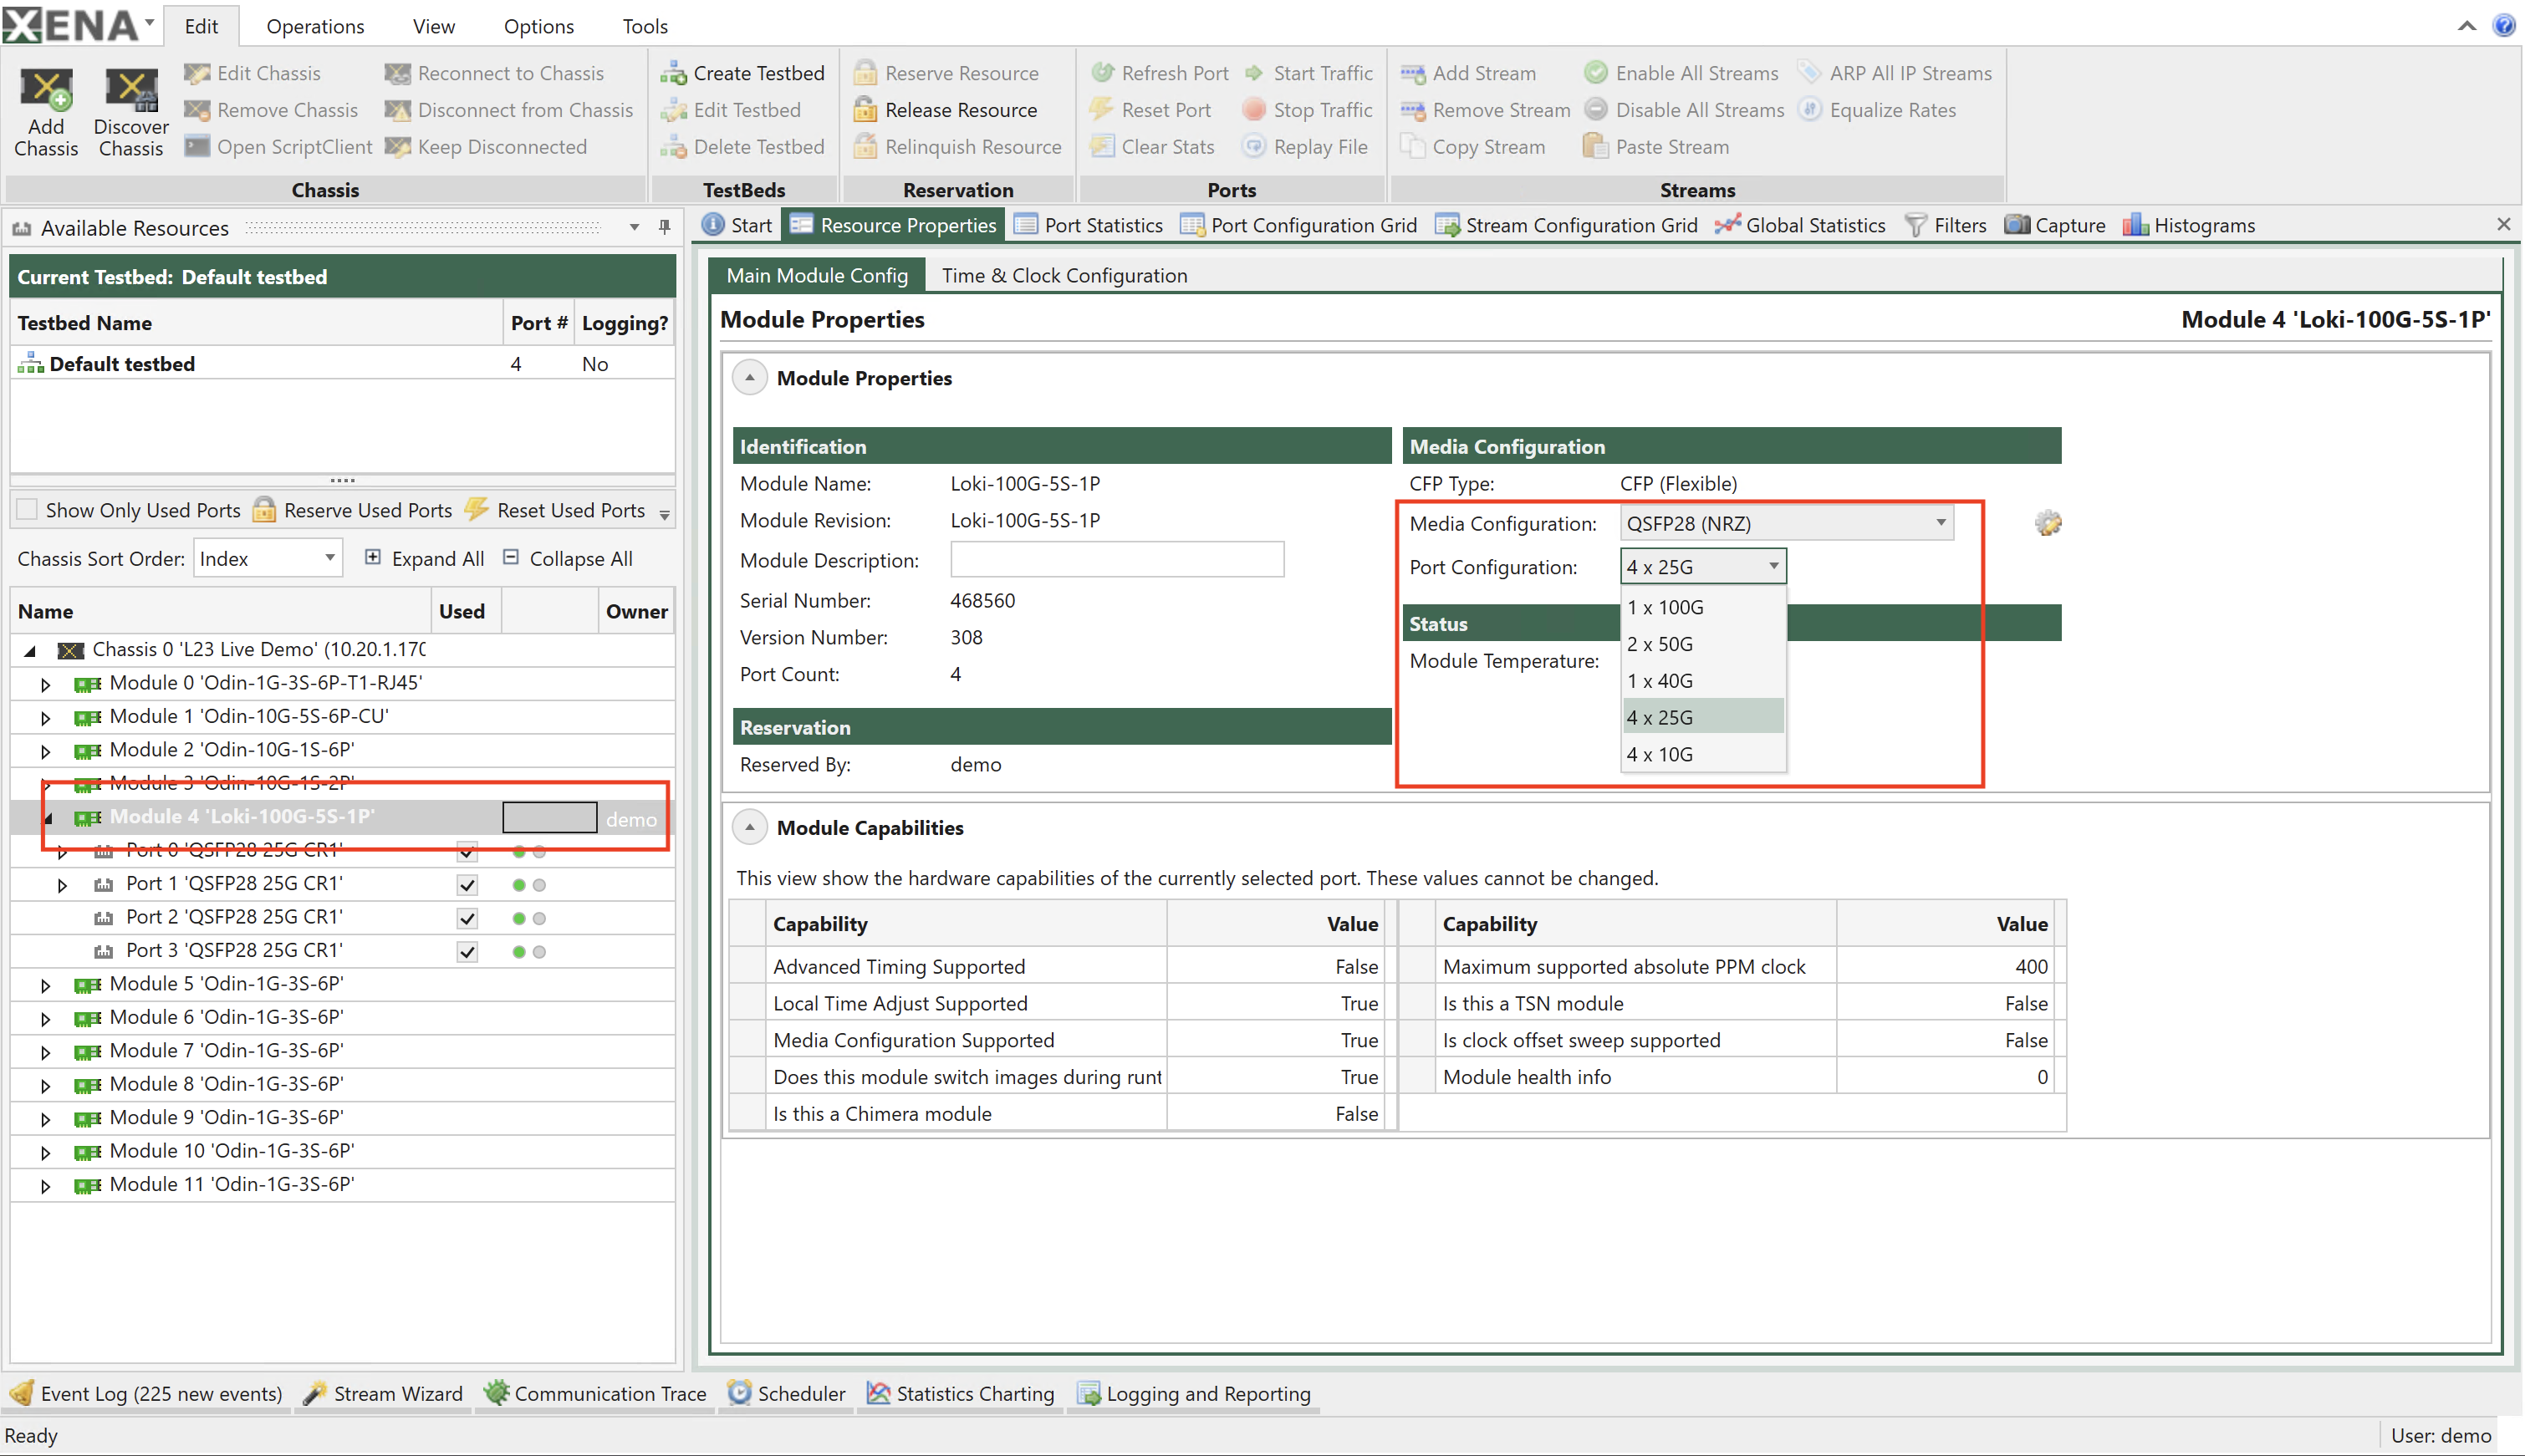
Fig. 3.4 Module media configuration and port configuration
Configure the required clock configuration from
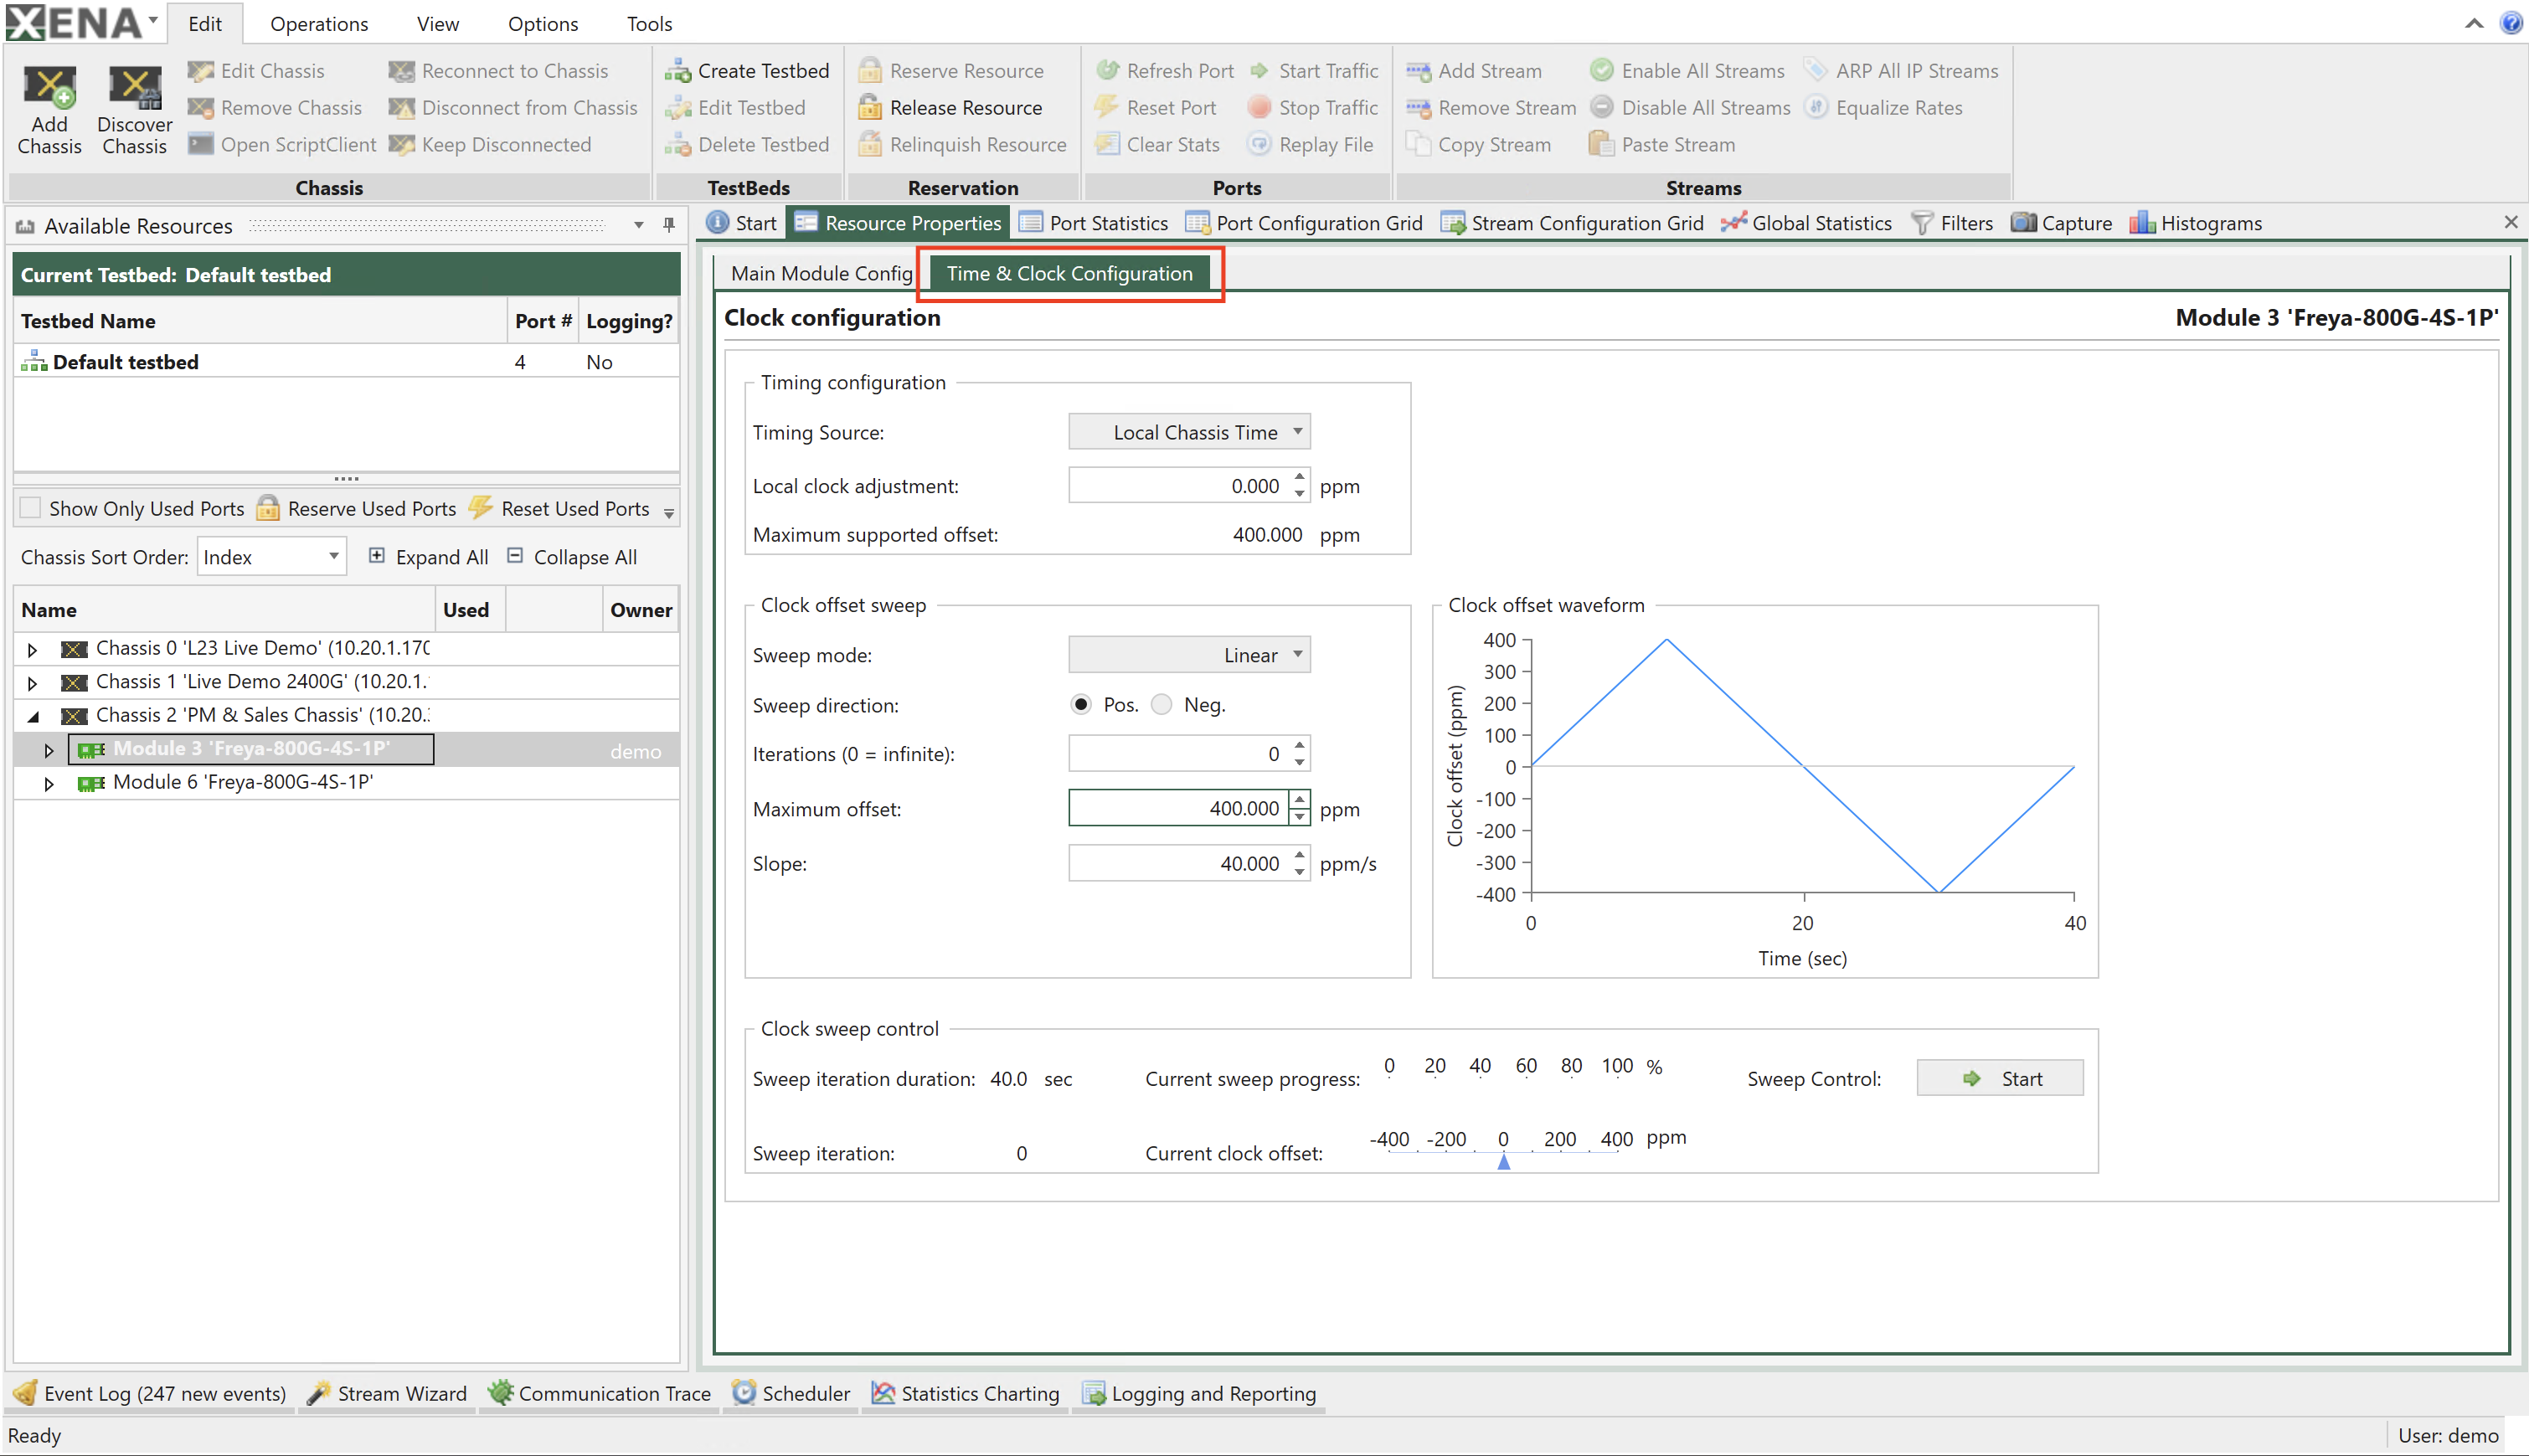
Fig. 3.5 Module media configuration and port configuration
Note
Note that ports are not automatically reserved just because you have included them in your testbed.
3.1.3. Add Port
Select the port(s) you want to use.
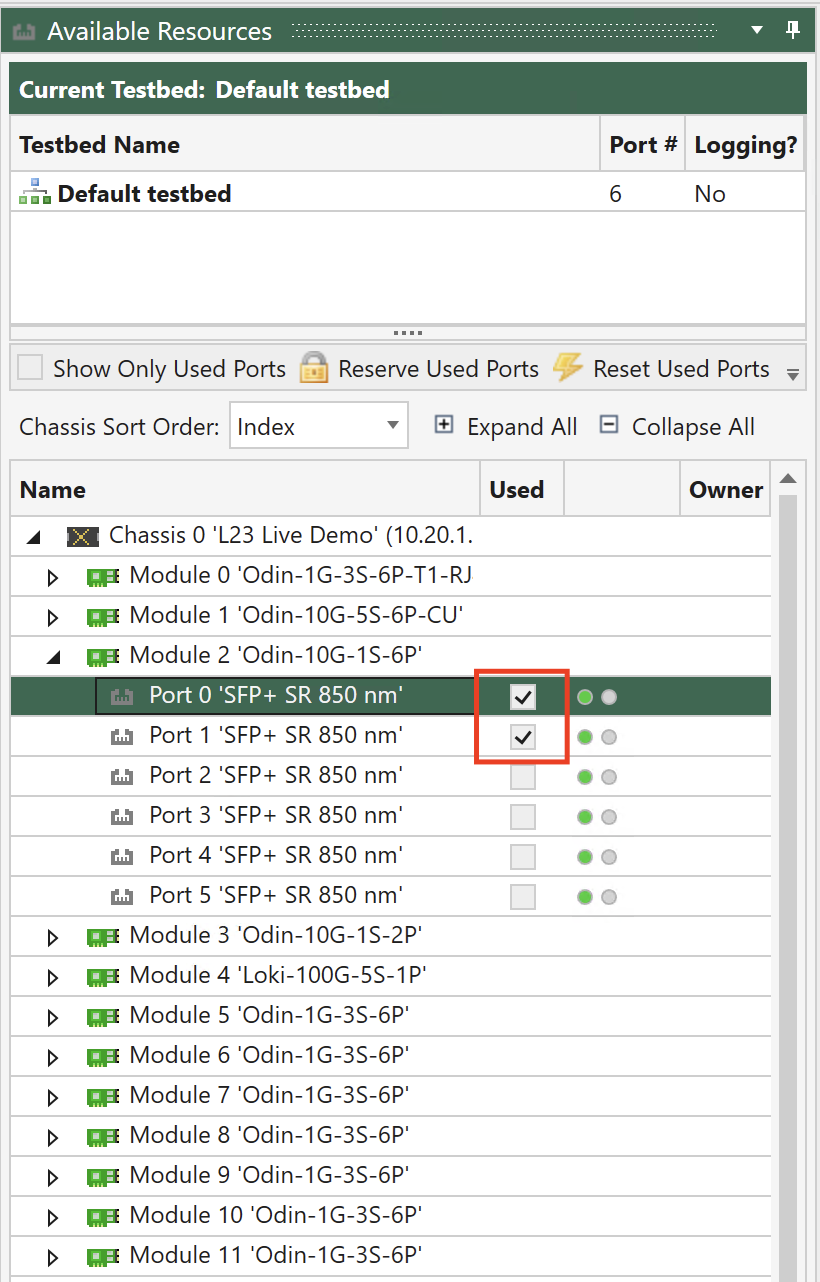
Fig. 3.6 Select ports
Click Reserve Used Ports, check Show Only Used Ports
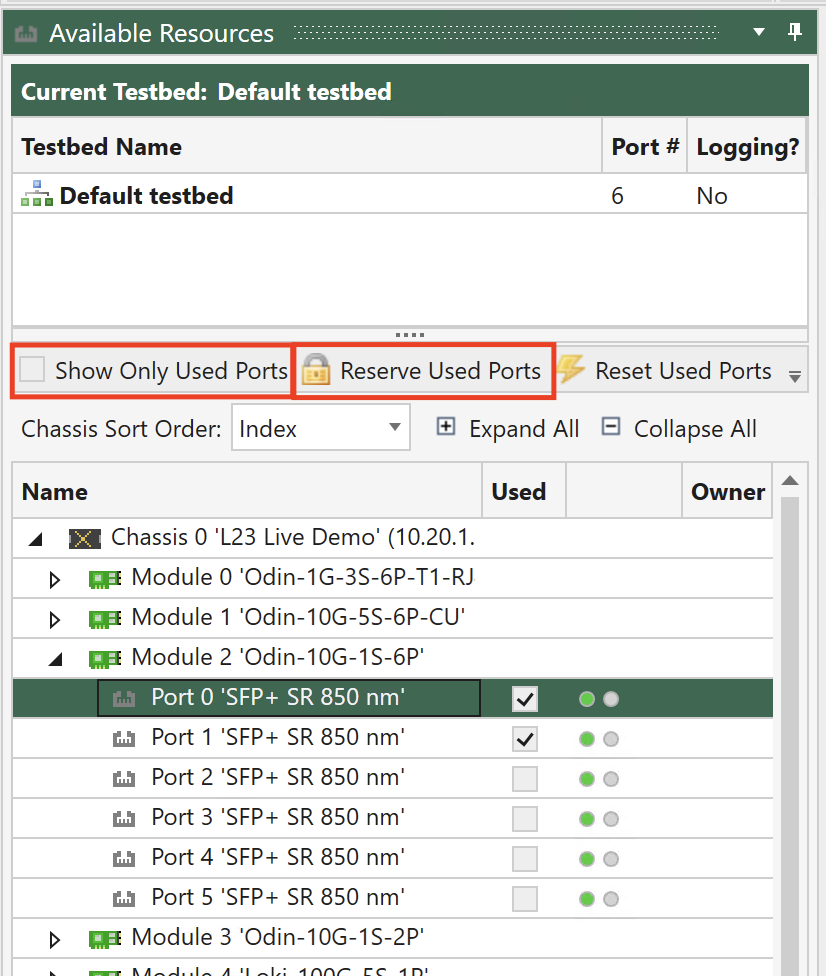
Fig. 3.7 Reserve used ports and show only used ports
3.1.4. Configure Port
Select the port(s) to configure and click tab. Configure the following port parameters to accommodate your test.
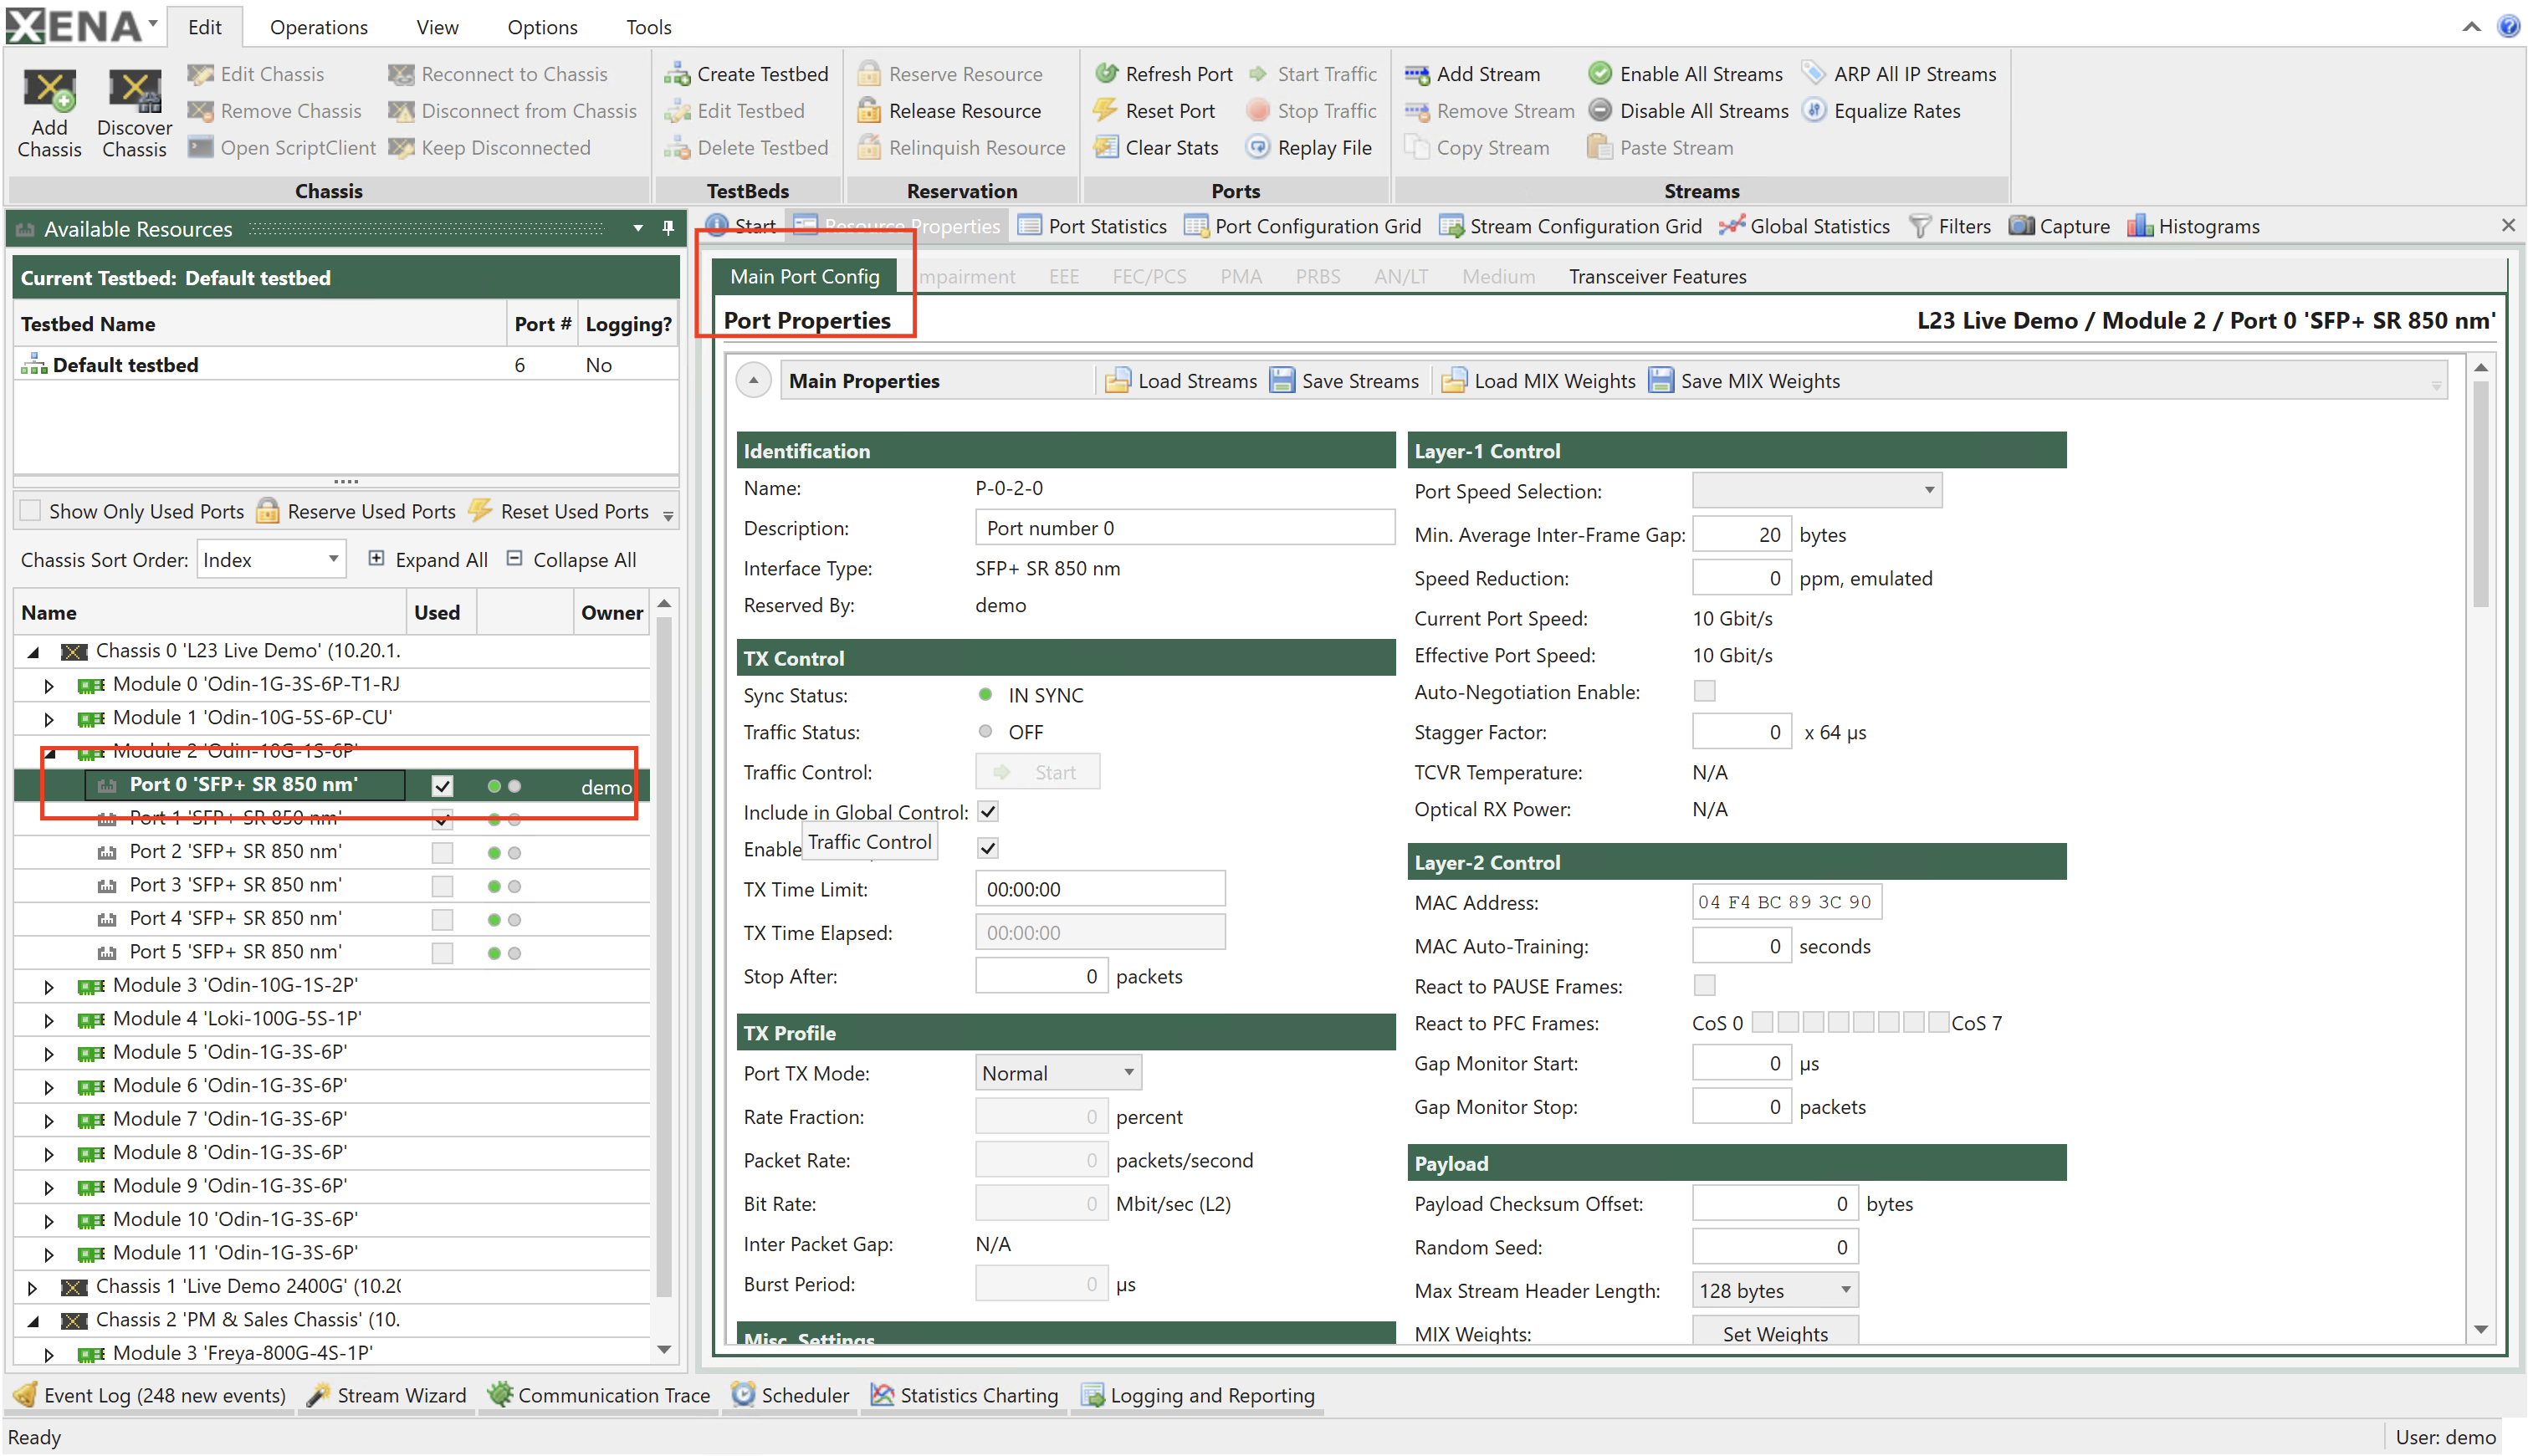
Fig. 3.8 Configure ports
Min. Average Inter-Frame Gap
Set to 20 –> 12B (Minimum allowed by Ethernet at 100% load) +8B Preamble
Can be set to 16B to achieve >100% load for port pressure testing
Values range between 16B to 20B depending on module.
MAC Address
Used as default SRC.MAC for each stream
Used when sending Ping or replying to ARP
MAC Auto-Training
Used to train DUT with Xena MAC so stream won’t be flooded
React to PAUSE Frames
This means enable Flow Control on this port
Gap Monitor
Used to monitor(time) the disruptions of service to traffic
Gap Monitor Start: After how many µs would the Monitor start
Gap Monitor Stop: After how many packets would Monitor stop
Results can be seen in port statistics (type of GAP can only be set)
Payload Checksum Offset
Used to enter a Headers + Payload Data Integrity Checksum
Should start from offset 14 for pure L2 packets
Should start after IP offset for L3 and beyond packets (because of TTL)
Max. Stream Header Length
When user wants to set headers larger than 128
Number of streams will be downsized to 1/2
Loopback Mode
Off: Traffic flows naturally out of the port
L1 RX to TX: Any received packet is bounced back through TX
L2 RX to TX: Same as 8.2 yet it also swaps MAC SRC<>DST
L3 RX to TX: Same as 8.3 yet it also swaps IP SRC<>DST
TX(on) to RX: Packet goes out of TX but also internally direct to RX
TX(off) to RX: Packet goes directly to RX (No link sync needed)
Port to port: Any received packet goes out through the neighbor port
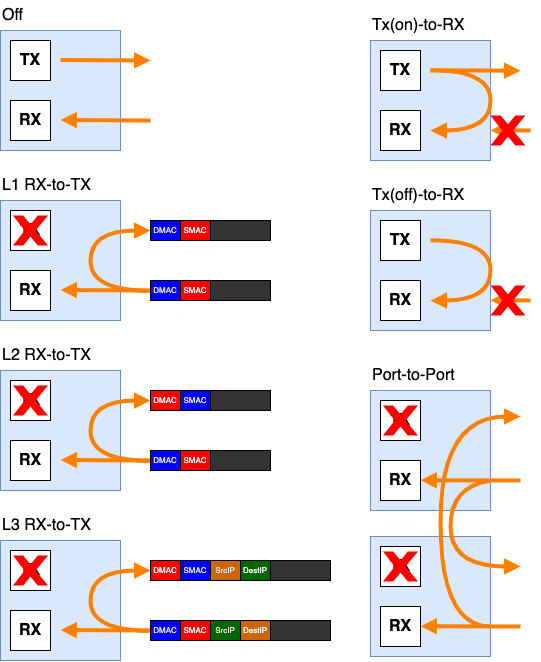
Fig. 3.9 Loopback mode
Latency offset
Used to automatically eliminate transceiver + cable latency
Set either manually or via Port Statistics calibrate button
IPv4
Address/Subnet/Gateway used for PING and ARP functionality
Reply to ARP/PING Requests
Enable port’s ability to reply to incoming ARP/PINGrequests
ARP and PINGv4 address Wildcard:
Used to enable multi unique ARP/PING requests
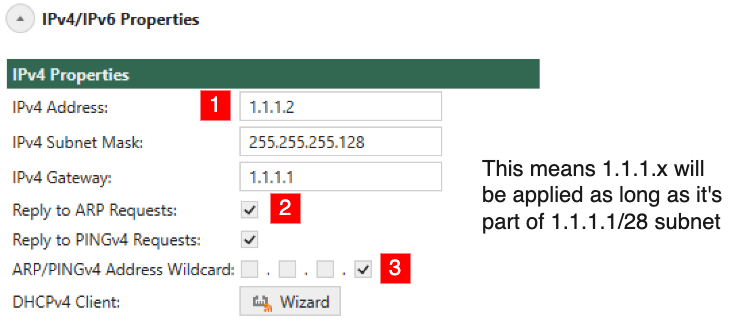
Fig. 3.10 IP settings
Some module supports the following.
Port Impairment
Link Flap: Set Duration, Repeat Period and Repetitions (0=continuous)
PMA Errors: Set BER coeff and BER exp for the error insertion
Payload Mode
Extended Payload
Custom Data Field
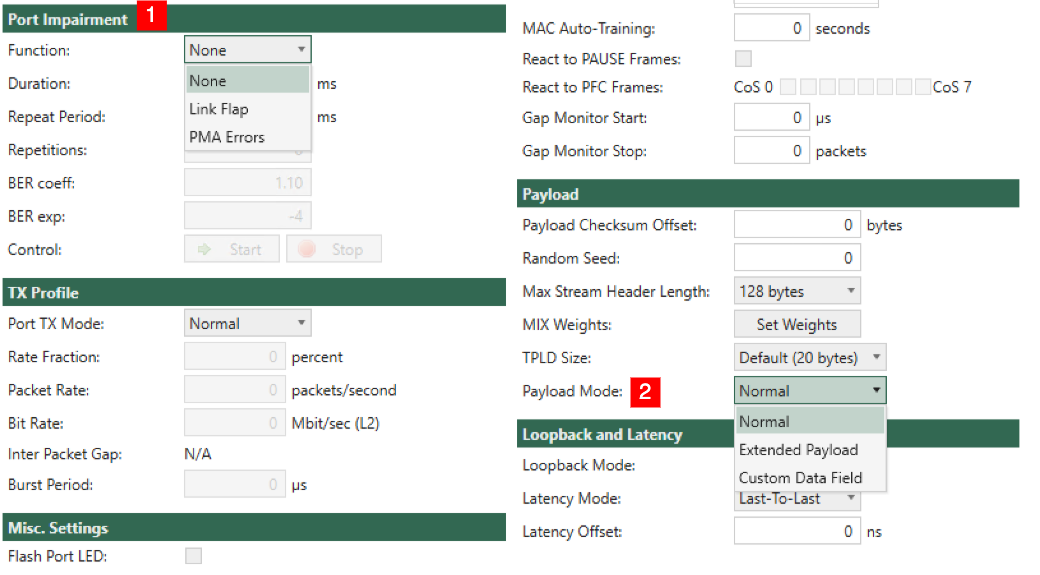
Fig. 3.11 Configure port impairment
See also
See application note Freely Programmable Test Packets (Custom Data Fields) for details.
3.1.5. Add Stream
To add a stream, click or right-click port and choose Add Stream, to add multiple streams select the Add Multiple Streams option.
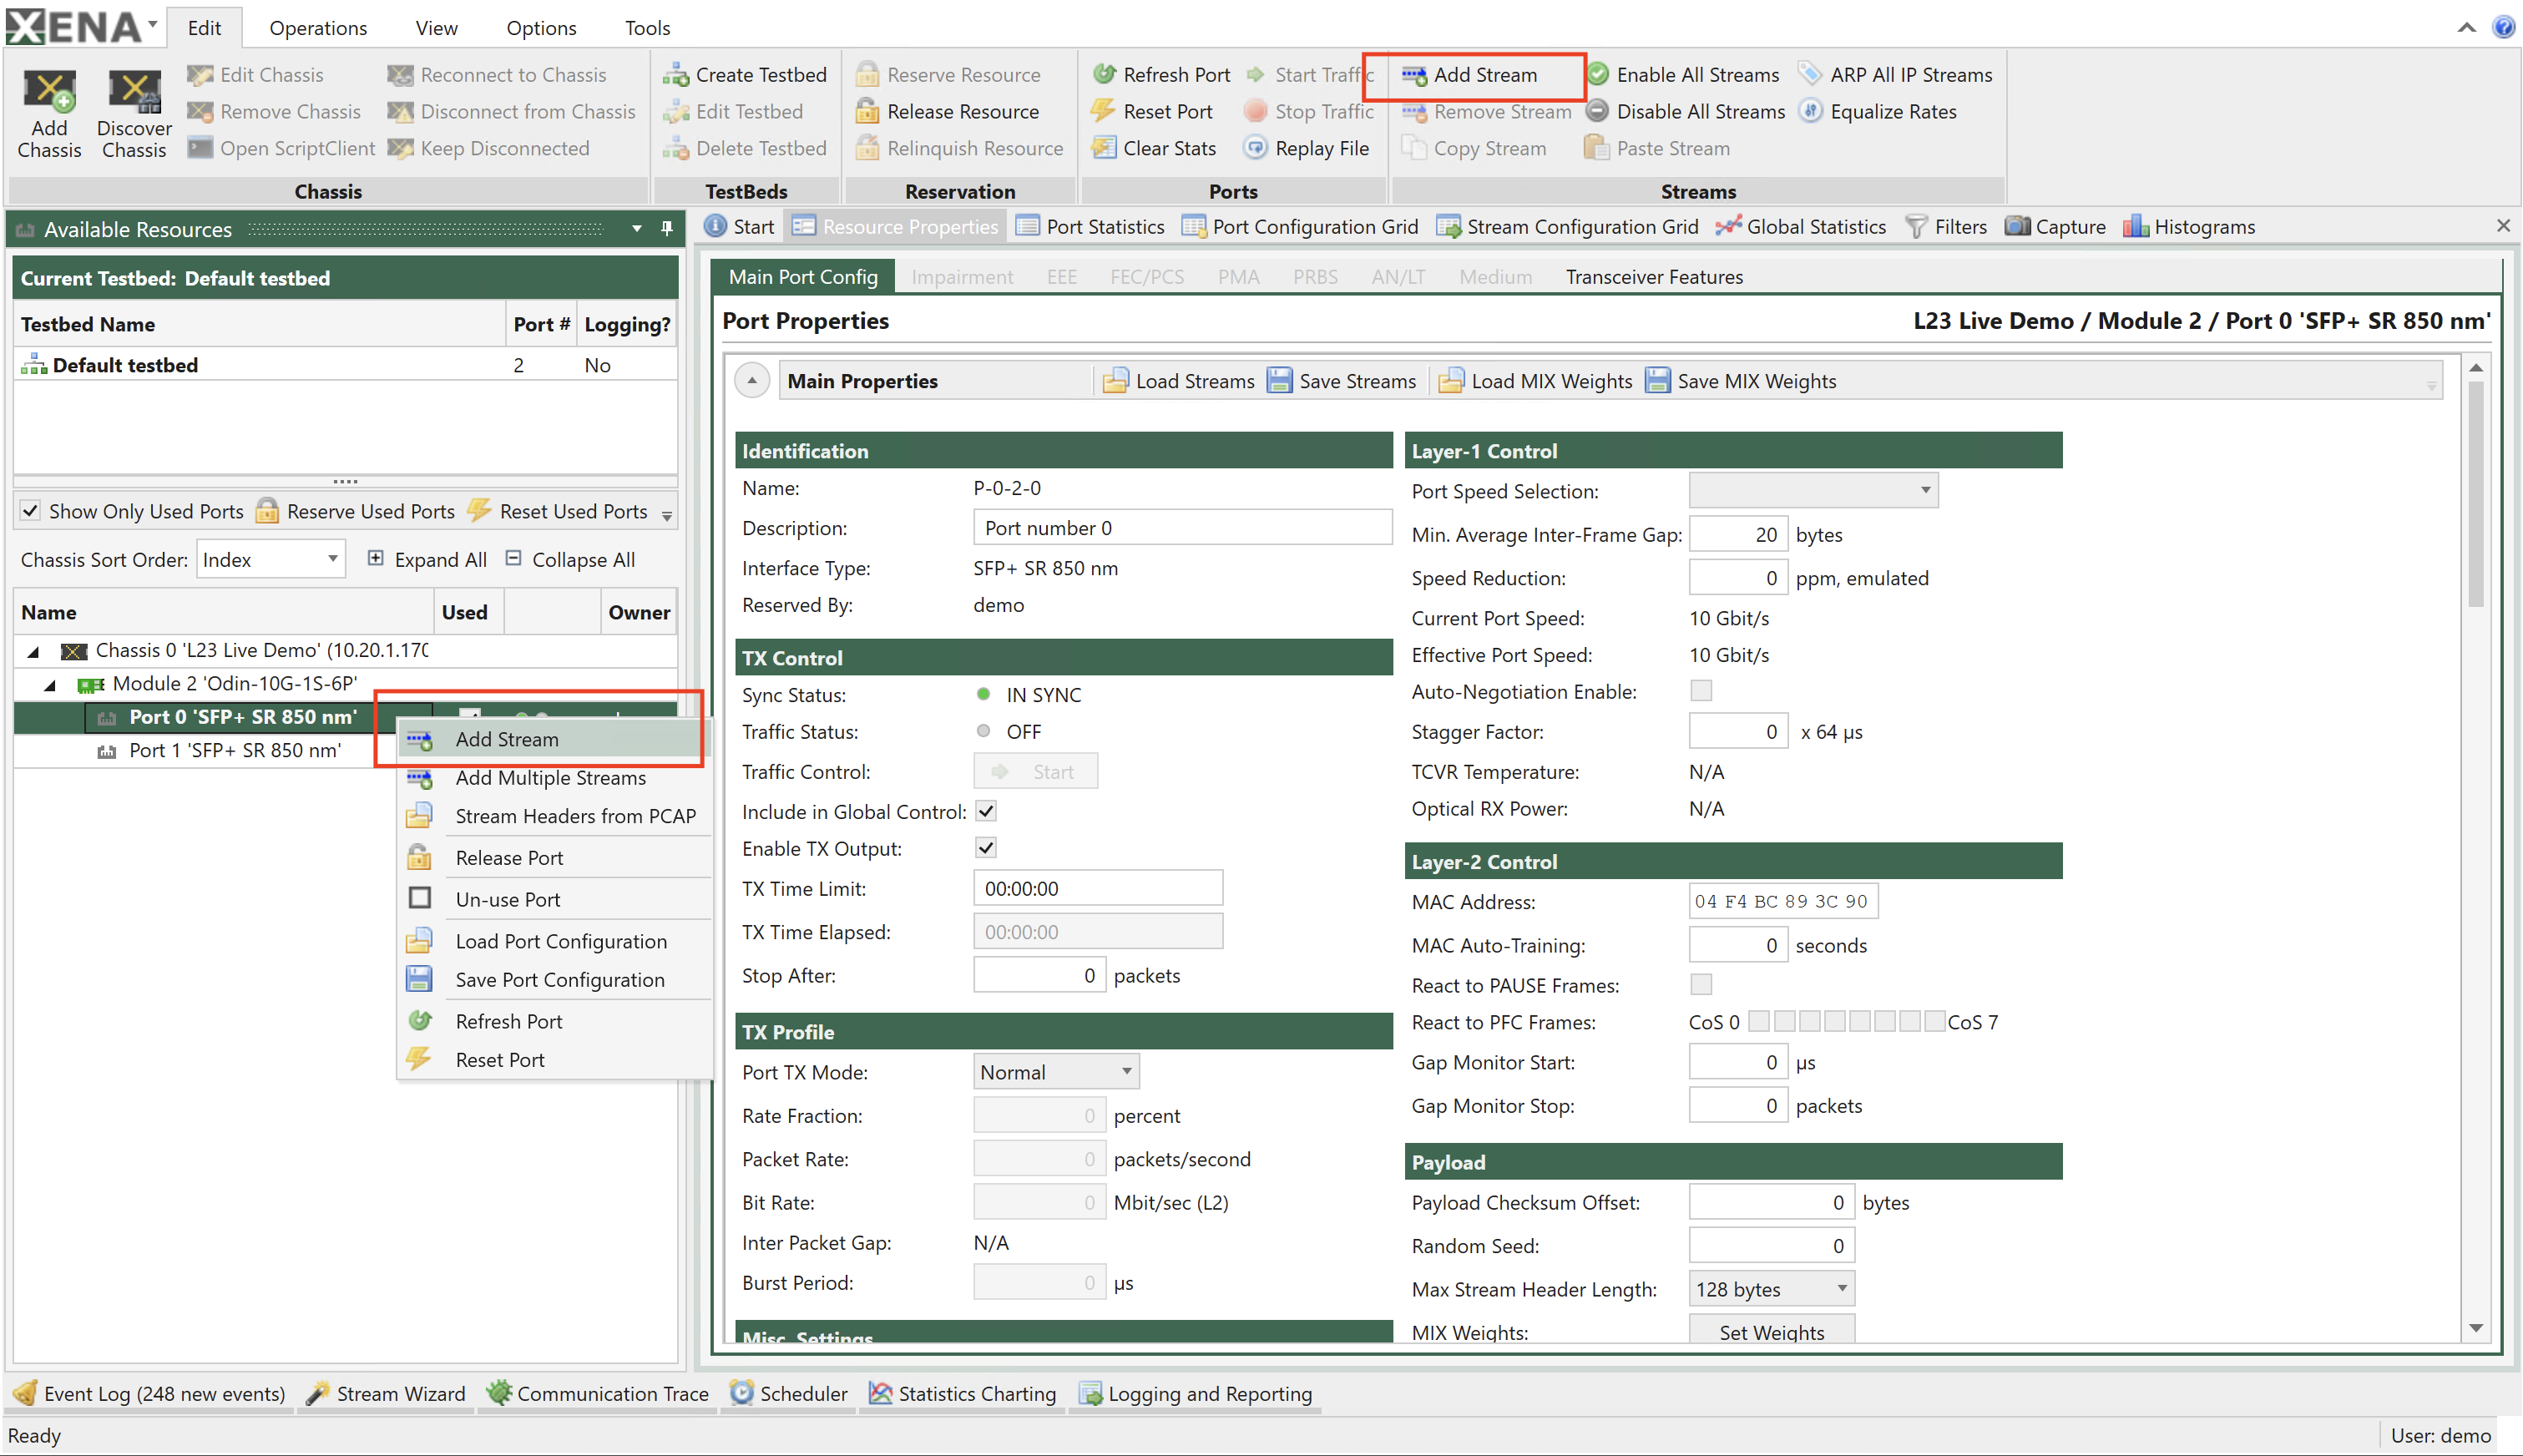
Fig. 3.12 Add stream
Copy Stream feature can also be used when user right clicks on any stream and then select copy stream and paste it anywhere.
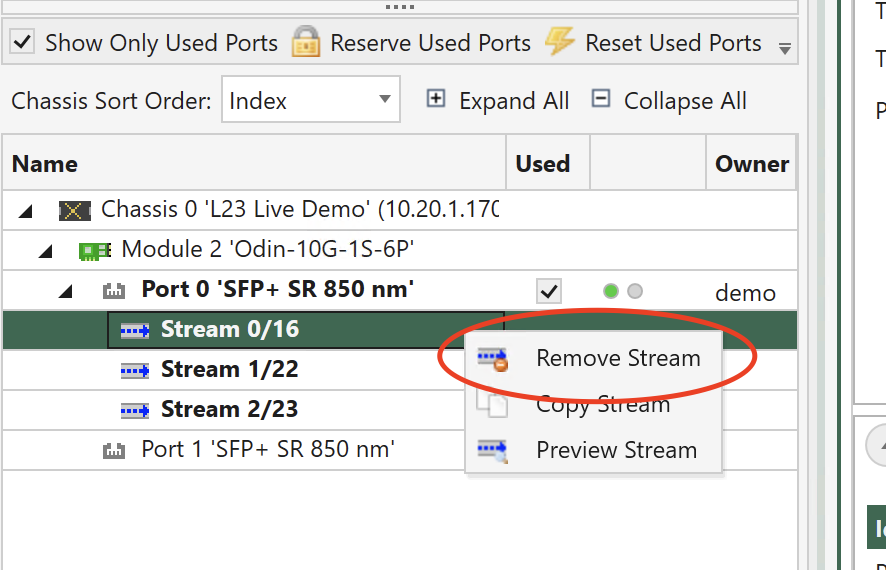
Fig. 3.13 Copy stream
3.1.6. Configure Stream
Select the new stream on the first port and ensure that you have selected the Resource Properties panel. The panel will now display the properties for the stream.
Insert test payload, TID: This is the stream ID used to identify Latency/Jitter/Packet Loss.
Description: Stream Description text (e.g. “Upstream connected to DUT Port 11”)
Stream State
Disabled: Stream is not started when traffic is ON nor is it included in port rate usage.
Suppressed: Stream is not started when traffic is ON, but it is included in port rate usage. (“Paused State”) can be switched to enabled on the fly.
Enabled: Stream is started when traffic is ON.
Stop After: Send specific number of packets and stop traffic. Also used in sequential mode as stream packet quantity.
Stream Transmission Profile:
Percent is L1 rate including IFG + Preamble.
Configuring on field actually changes all the others accordingly.
Grayed text can be edited. To have it set you need one more click.
Burst used to configure bursty traffic. Density sets the inner IFG inside the burst. There is a trade-off between the stream rate and the Burst rate.
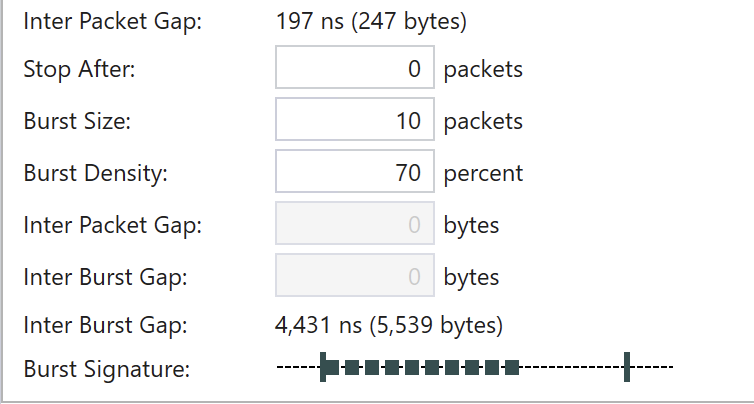
Fig. 3.14 Burst profile
Error Injection: Can send specific errors on the fly - but only when traffic is ON.
Insert Frame Checksum, FCS: Unchecking this checkbox will cause error frames.
Packet Length:
Fixed - for min value =x all packets will be x
Incrementing - for min value =100 and max value=200 e.g. 100, 101, 102, 103, … ,197, 198, 199, 200, 100, 101, 102
Butterfly - for min=100 max=200 e.g. 100, 200, 101, 199, 102, 198, 103, 197, 104, 196, 105 …
Random - random values between min. and max.
Mix - sends internet mixture of packet sizes. For some modules 4 packet sizes are programmable. If not supported the programming boxes are dimmed.
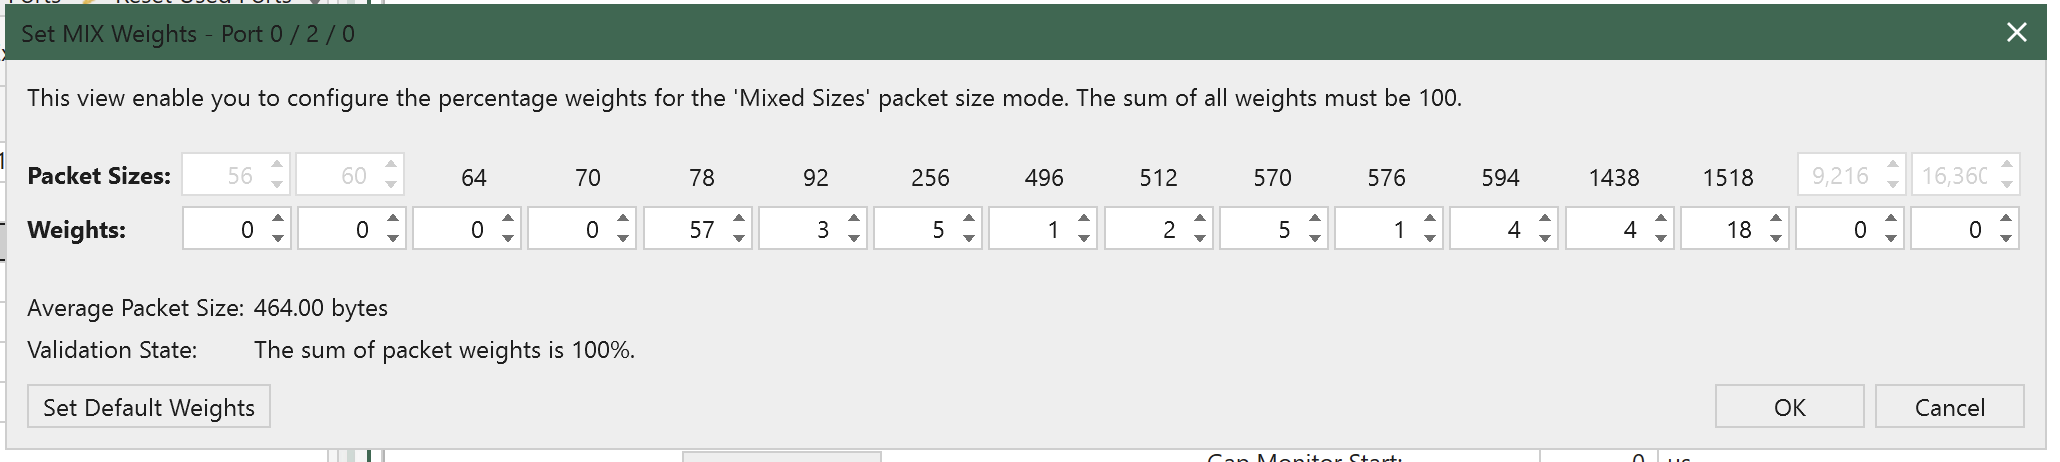
Fig. 3.15 MIX Weights sets can be loaded saved via the port resource properties
Payload Type:
Incrementing 8-bits - means 00 01 02 03 04 05 … Provides built in payload integrity check for payload.
PRBS-31 - provides Pseudo Random Bit Sequence of
2^31-1pattern. Payload integrity error detection requires non-zero Payload Checksum Offset in port properties of both TX and RX ports.Random - provides Random bit Sequence pattern. Payload integrity error detection requires non-zero Payload Checksum Offset in port properties of both TX and RX ports.
Pattern - you can set your own custom pattern. Payload integrity error detection requires non-zero Payload Checksum Offset in port properties of both TX and RX ports.
Decrementing 8-bit: means FF FE FD FC FB FA … Payload integrity error detection requires non-zero Payload Checksum Offset in port properties of both TX and RX ports.
Incrementing 16-bit: means 00 00 00 01 00 02 00 03 00 04 00 05 … Payload integrity error detection requires non-zero Payload Checksum Offset in port properties of both TX and RX ports.
Decrementing 16-bit: means FF FF FF FE FF FD FF FC FF FB FF FA… Payload integrity error detection requires non-zero Payload Checksum Offset in port properties of both TX and RX ports.
Important
When using Incrementing 16-bit or Decrementing 16-bit, you need to check the option Payload Start From 0 to have the payload 00 00 00 01 00 02 00 03 00 04 00 05 … or FF FF FF FE FF FD FF FC FF FB FF FA….
Scroll down to the Packet Header Definitions section in the stream properties view. Here you will find a Wireshark-like protocol header editor which allows you to define the protocol headers for the stream. Expand the Ethernet segment to view the fields in the segment.
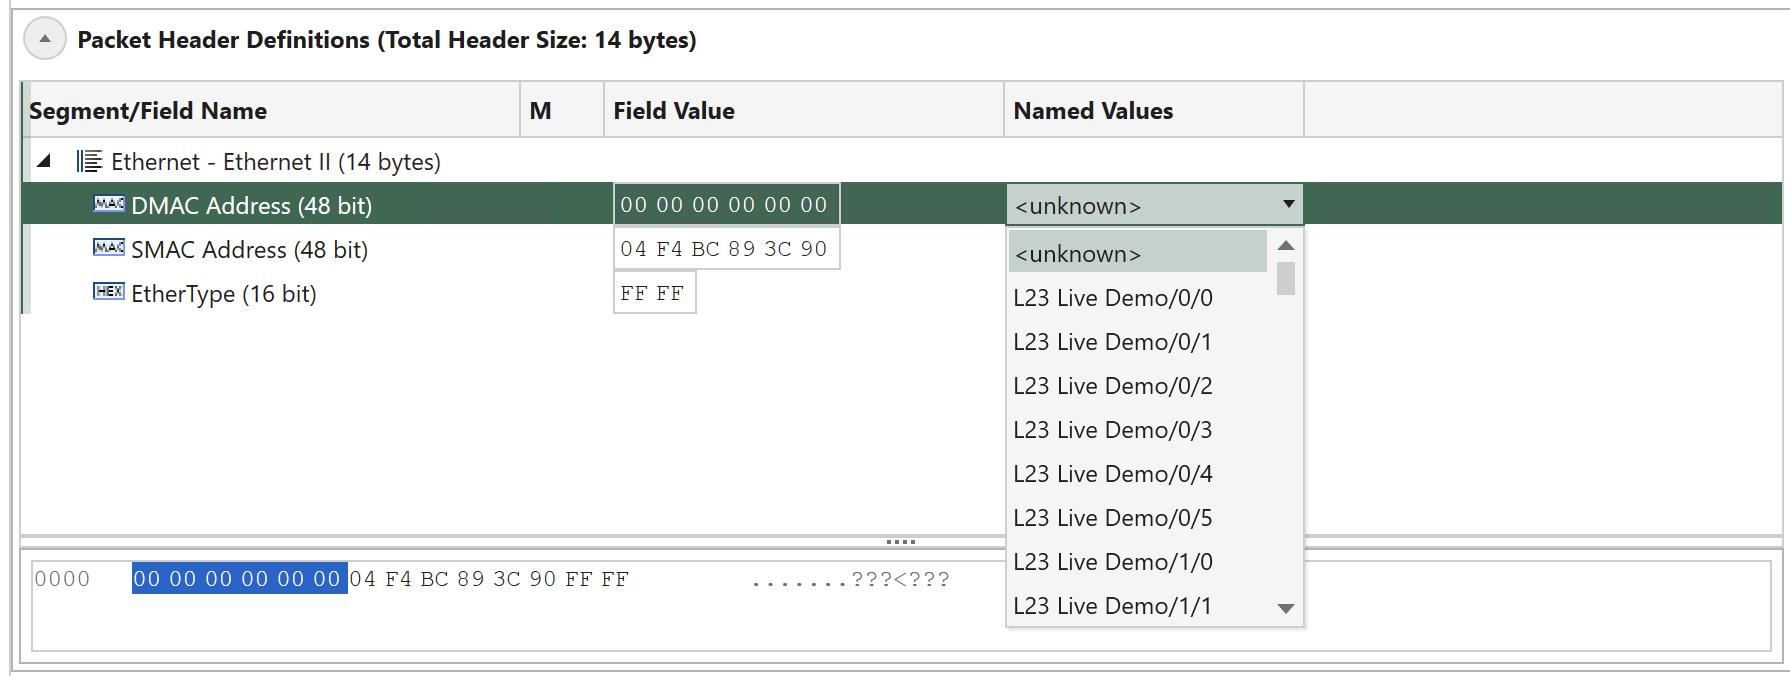
Fig. 3.16 Packet header definition
Note
Note that the Src MAC Address field has been automatically set to the MAC address of the containing port. Expand the dropdown-box in the Named Values column for the Dst MAC Address and locate the other port in your testbed. Note that the Raw Value column is also automatically updated with the MAC address of the peer port.
3.1.7. Set Up Simple Bidirectional Traffic
Add 1 stream for each traffic port (right-click and select Add Stream)
Select both streams using the Available Resources panel and CTRL.
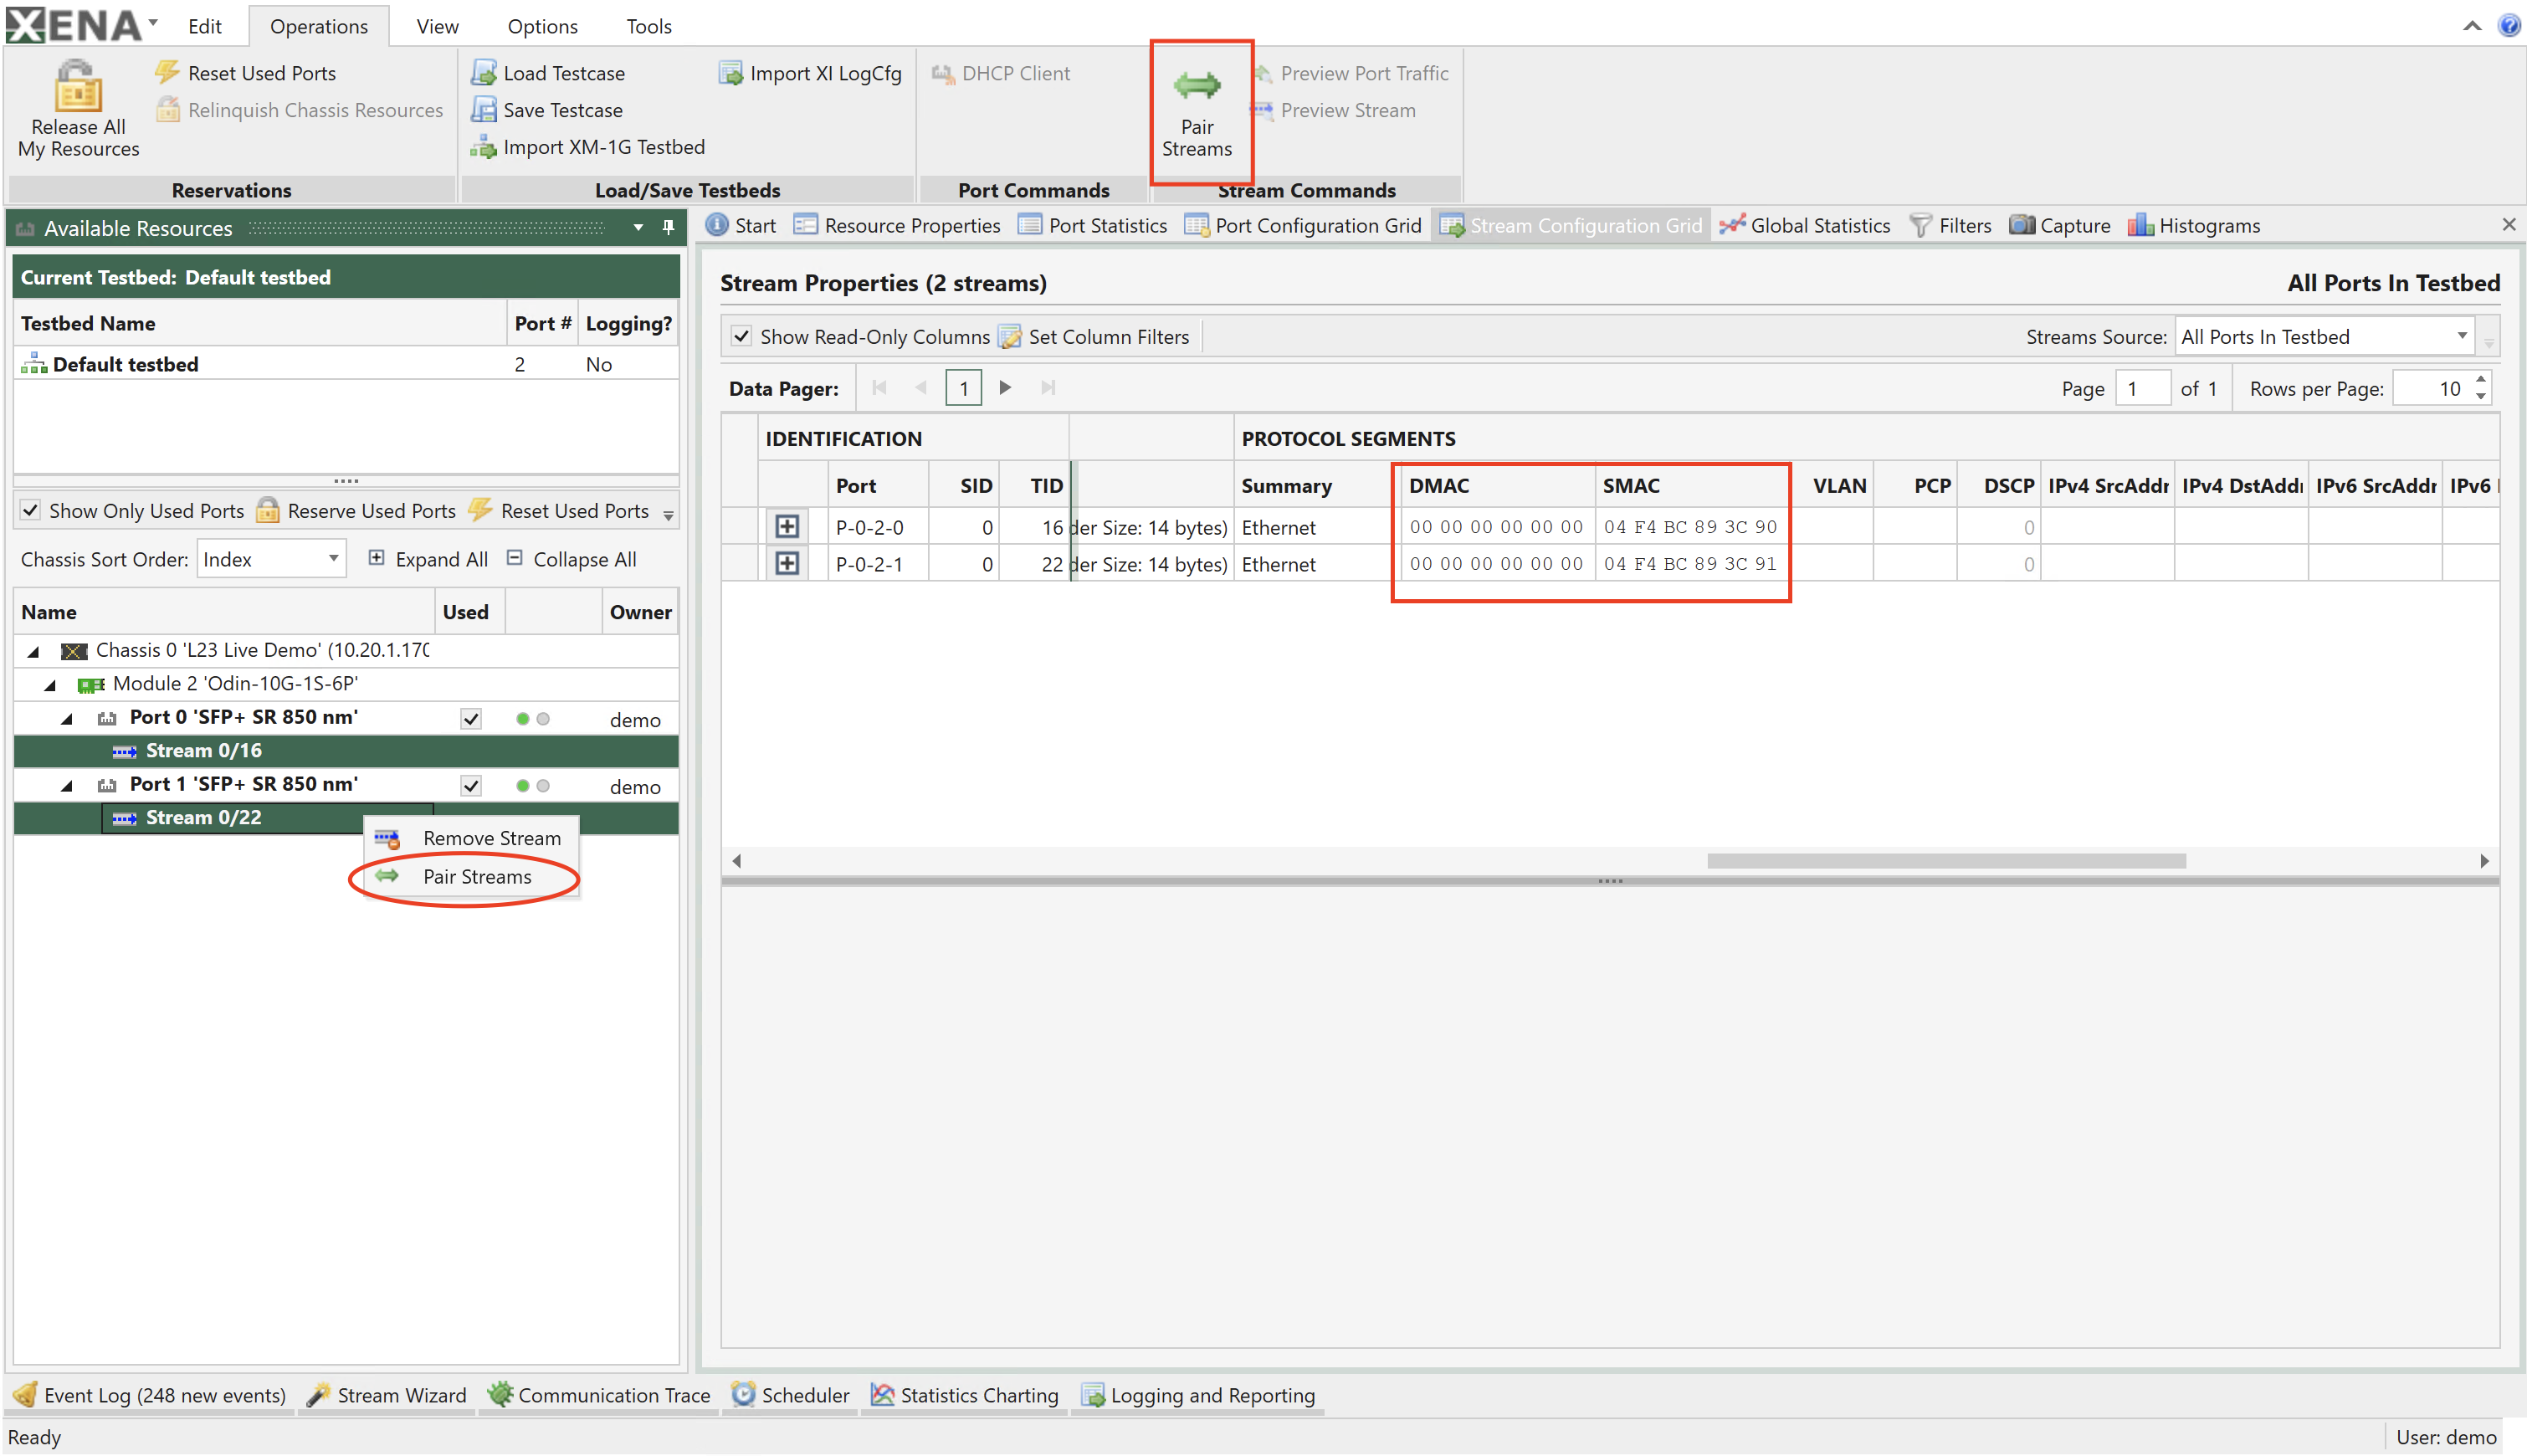
Fig. 3.17 Pairing streams
Clicking Pair Streams results in:
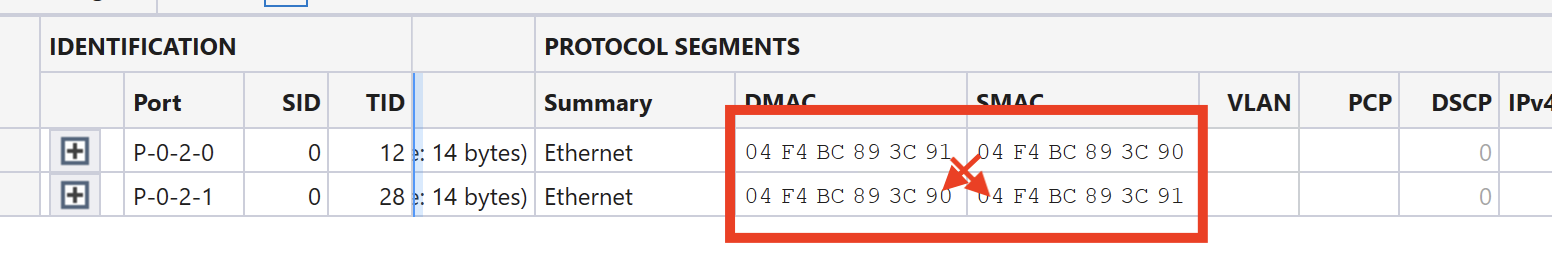
Fig. 3.18 Streams paired
3.1.8. Stream Scheduler
The Stream Scheduler can be used to build a series of actions (operations) based on existing streams in the current testbed.
Before starting the Stream Scheduler, you must reserve ports and configure ports and streams. Example: 120 times the traffic is running for 5 seconds and then stopped for 5 seconds:
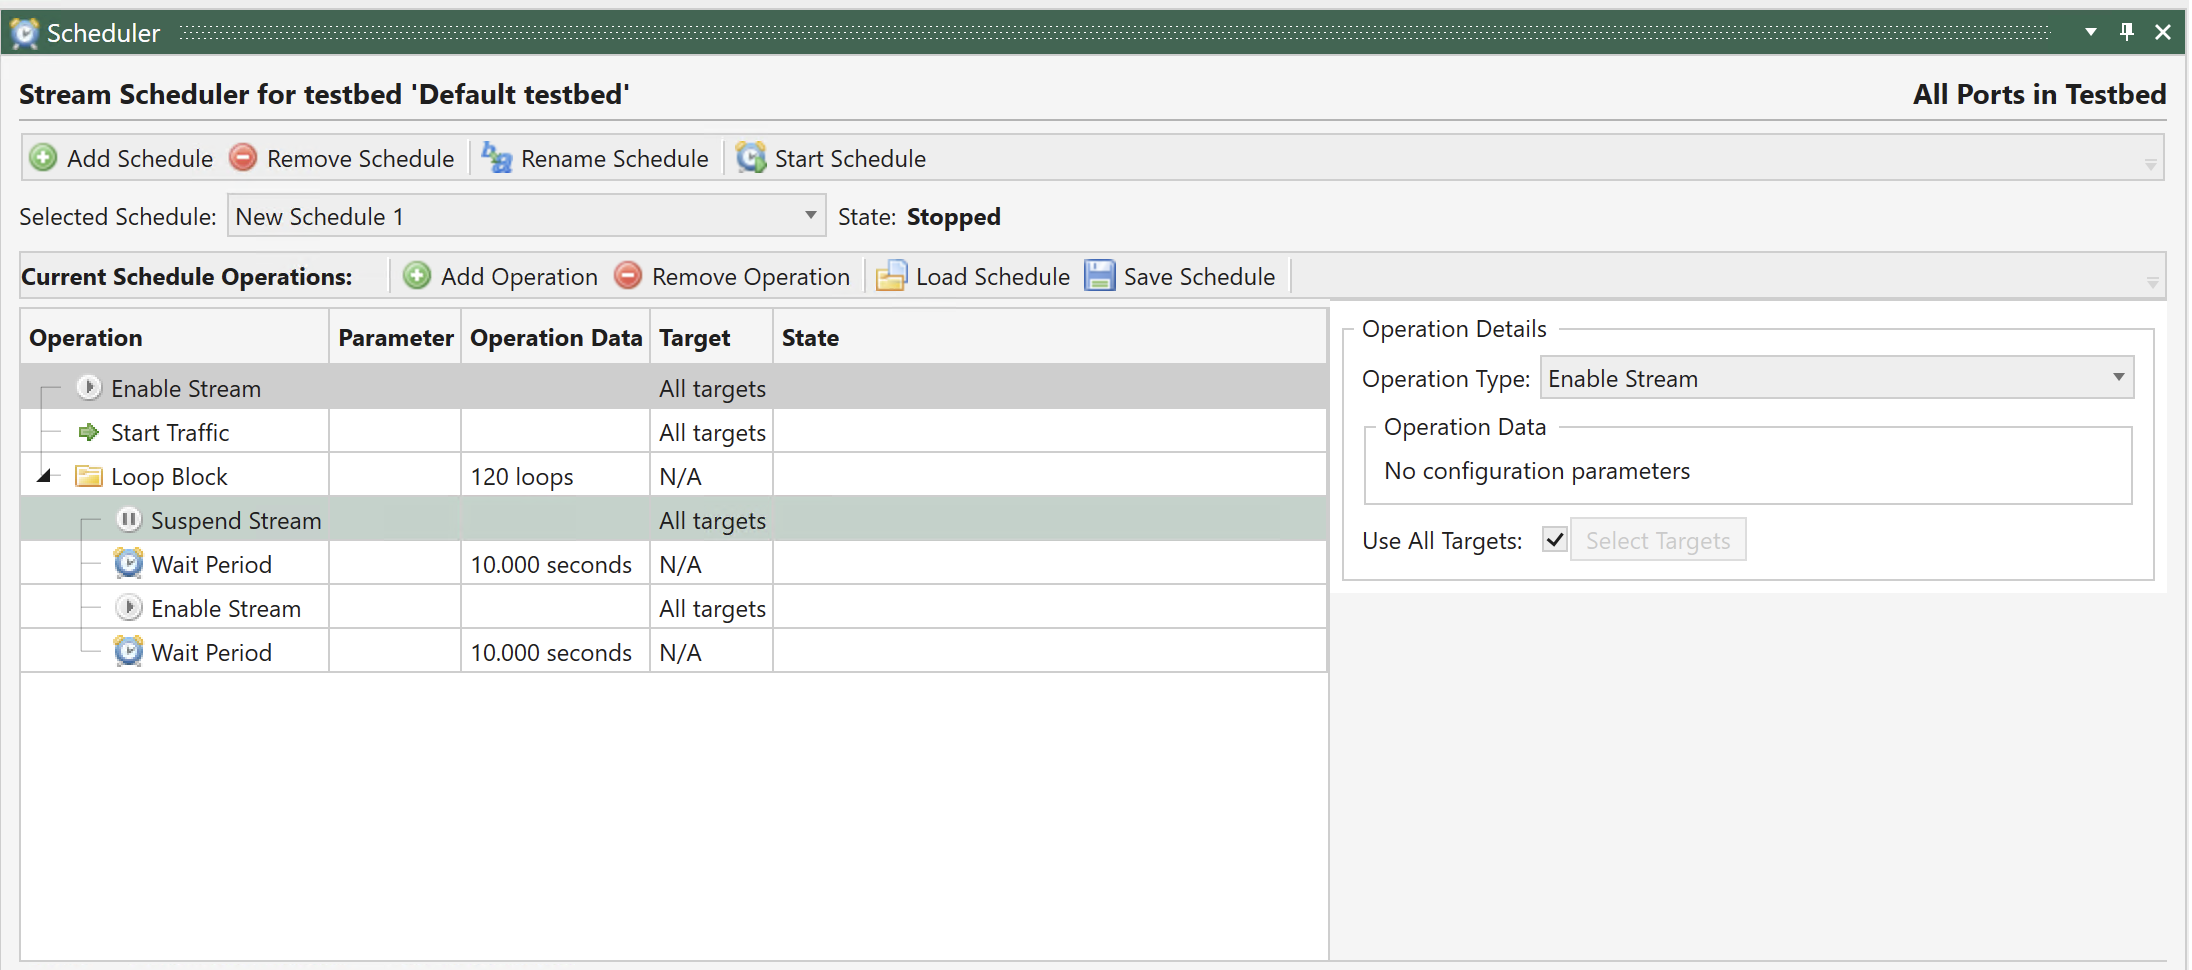
Fig. 3.19 Stream scheduler
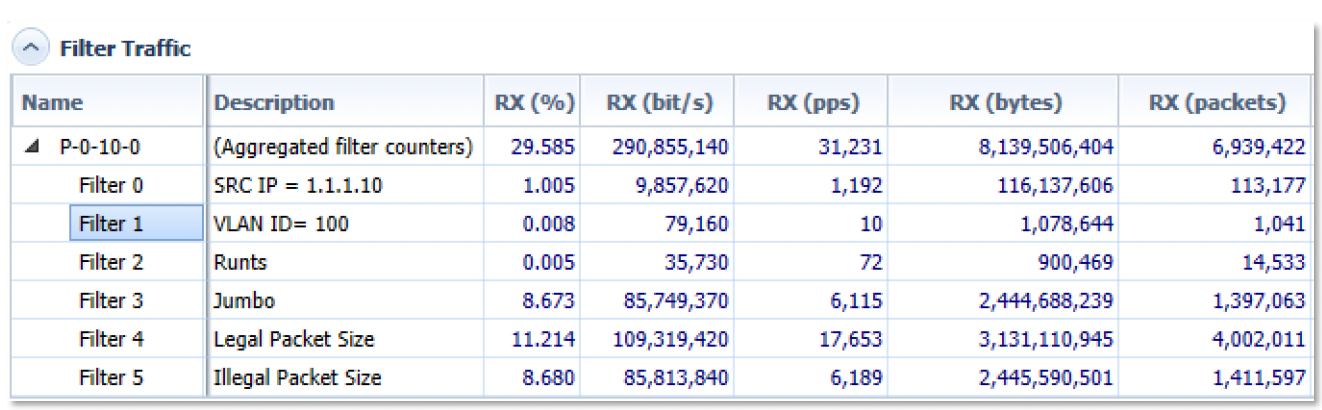
3.1.9. Filters
Filters are used in order to get statistics on specific types of packets either specific content or specific packet size.
Note
These filters can also trigger the Capture mechanism or focus Histogram results.
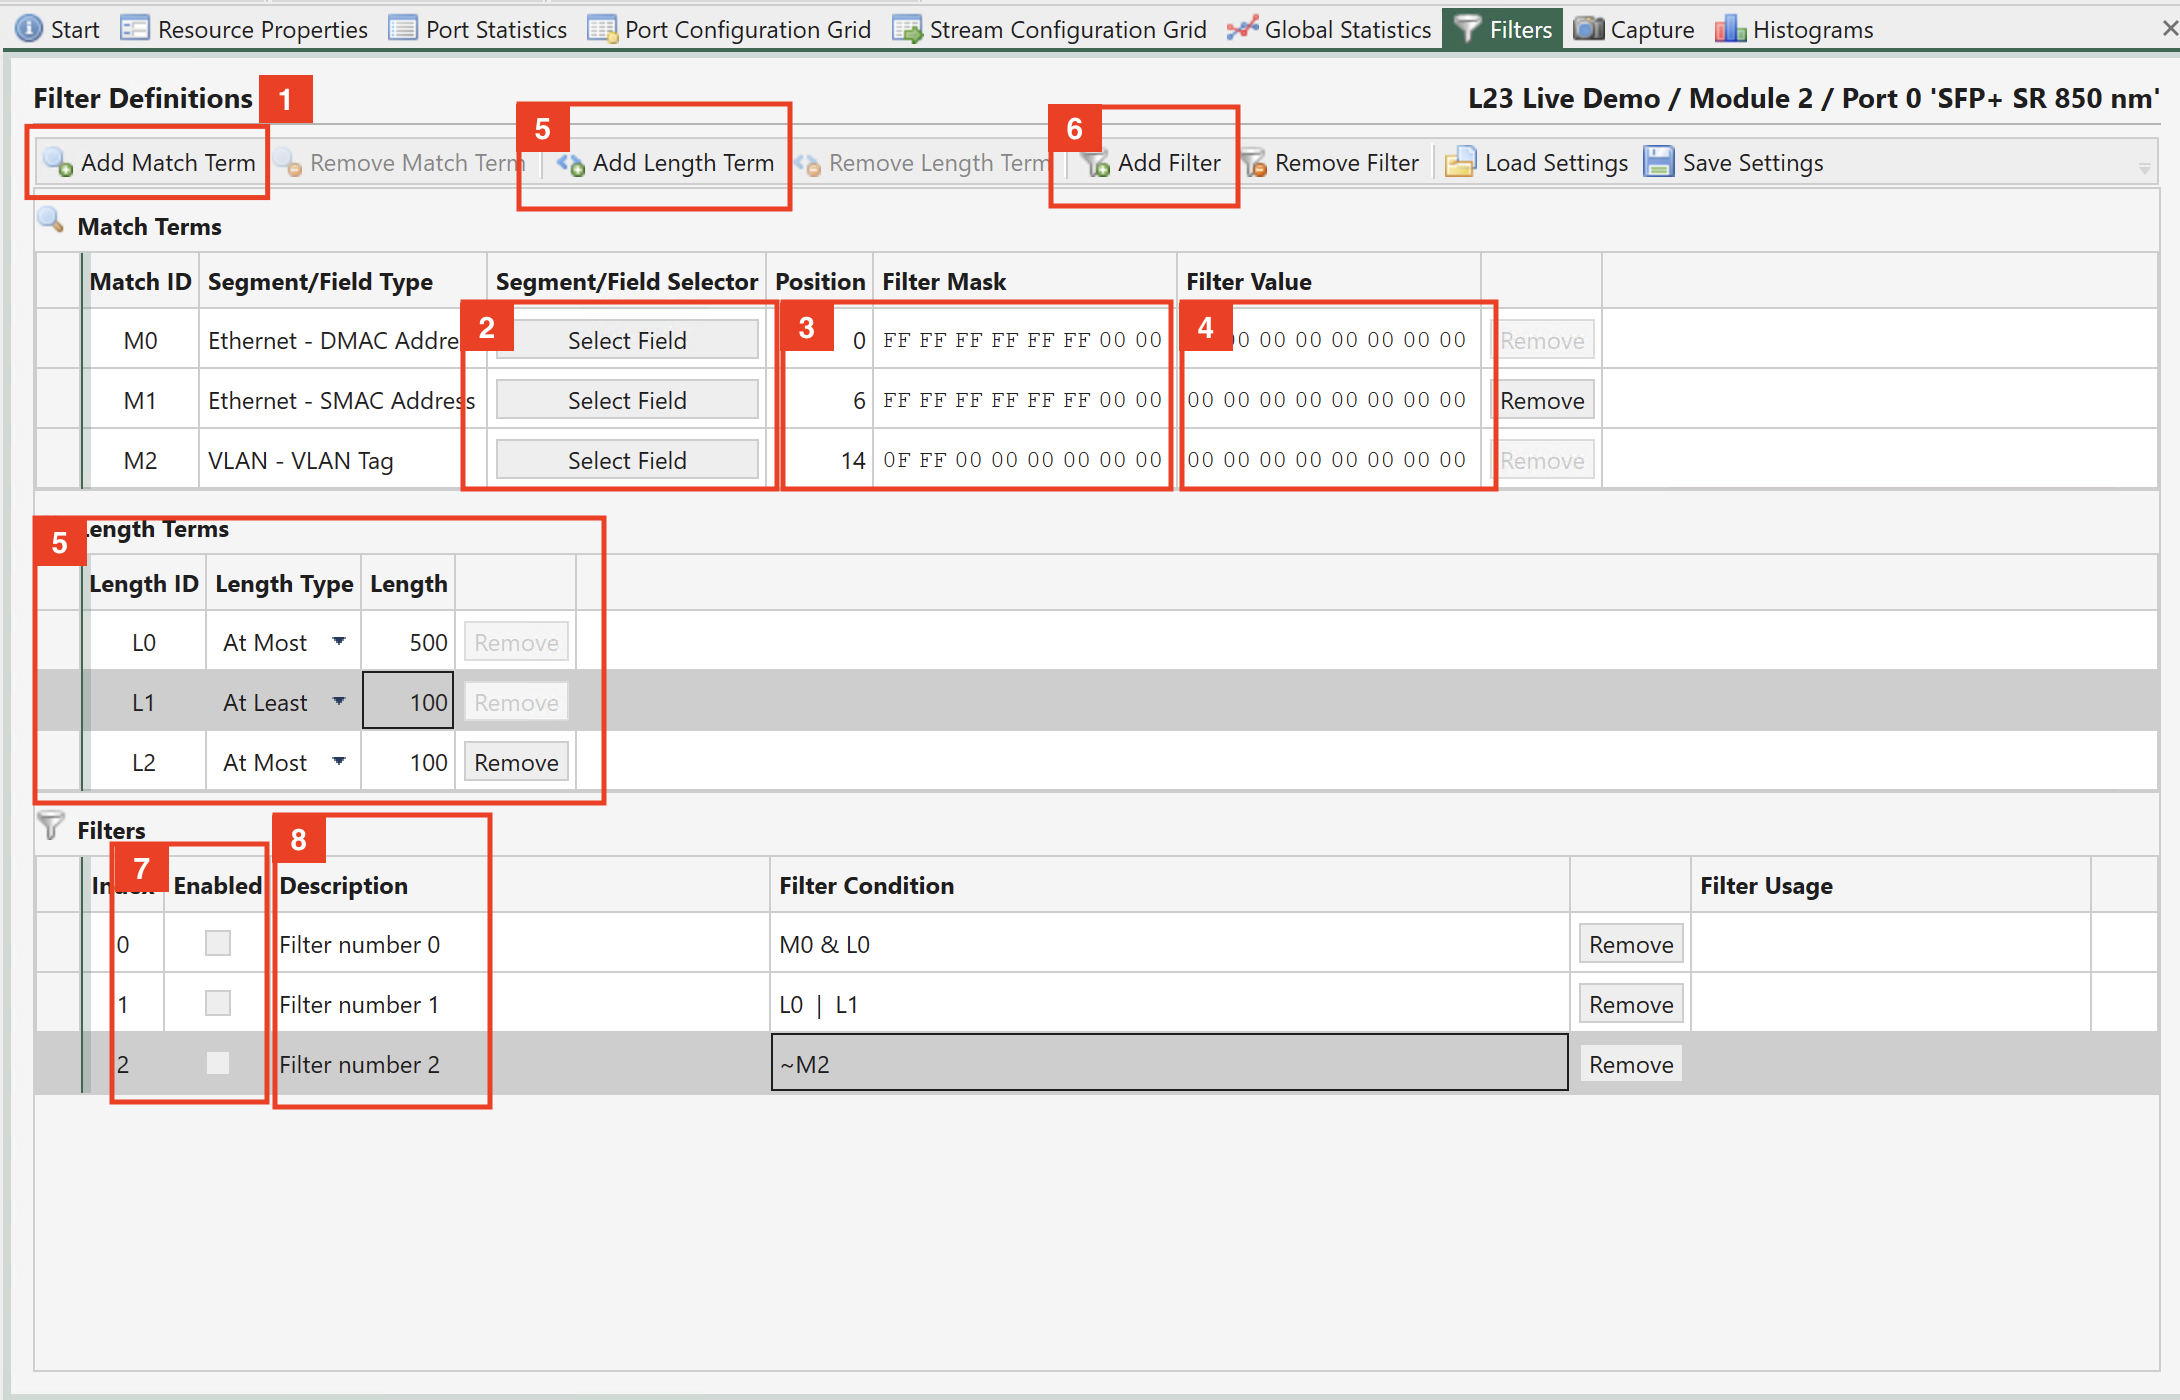
Fig. 3.20 Port filters
Add match term - click to add new match term. Added to provided Statistics for a matched packet (e.g. Packets of VLAN 100)
Click to access the field you want to match (headers must be added manually per match term).
Position is set to beginning of field e.g. if you want to match last octet of IP, the offset should be incremented manually. Mask - to focus on a specific Byte the other should be set to
00Value - The value you would like to match (the value is in Hex so 50Dec = 32Hex)
Length term - used to find specific packet sizes
Add filter - click to add/build a new filter based on match terms
Enable - checkbox to enable a filter to be present in the results and capture trigger
Describe - Name of the filter
Note
Filter Condition - Build a filter based on pre built terms using the &, |, and ~ operators.
Filter results under
3.1.10. Capture
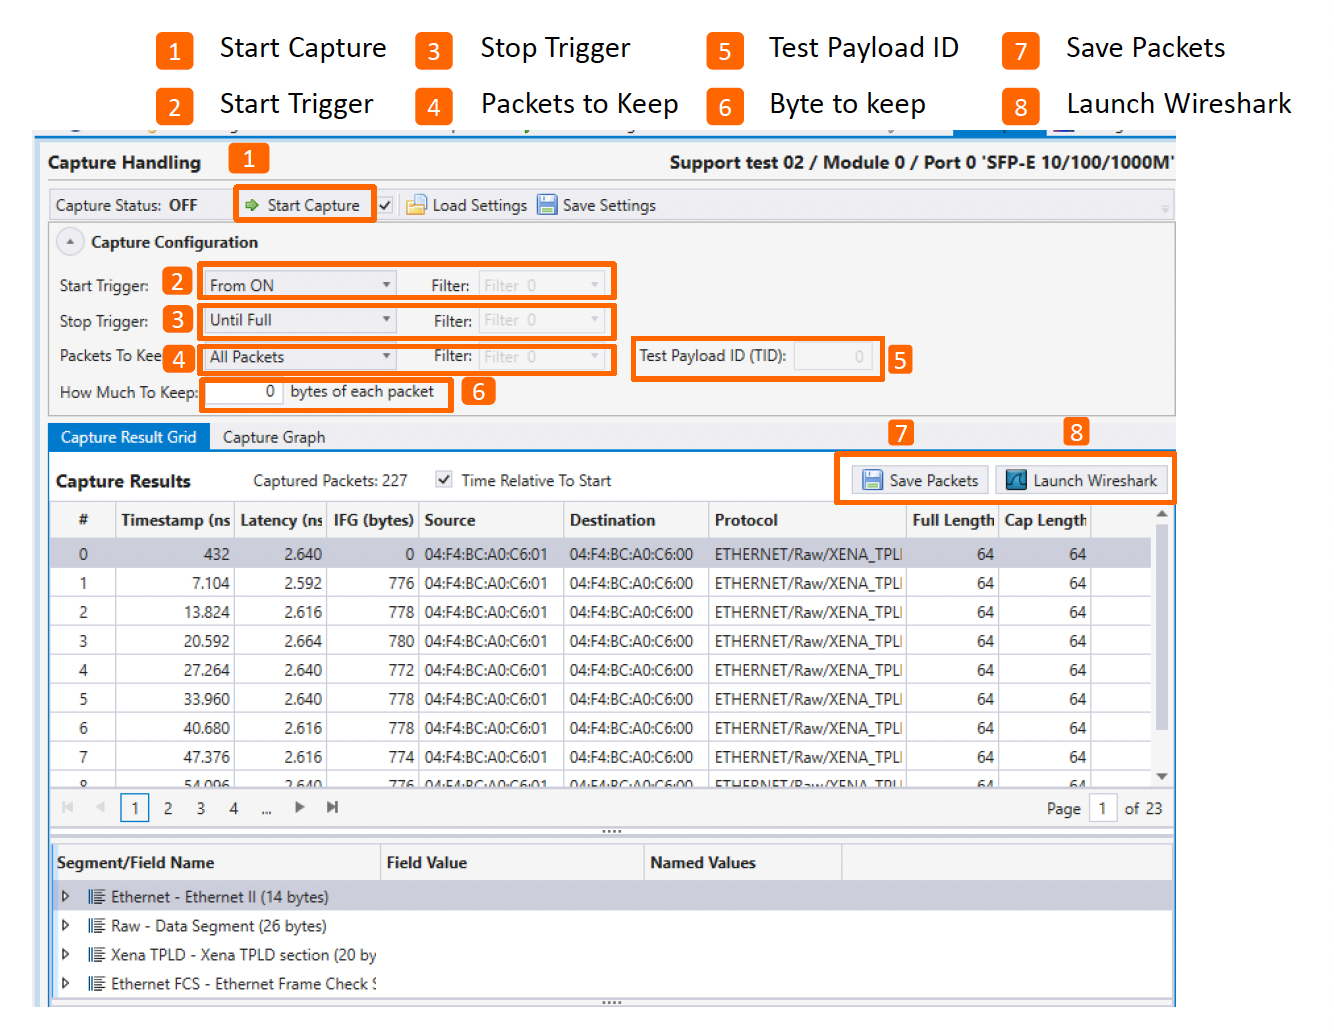
Checkbox enabled means when click Start/Stop in global view, capture mechanism will Start/Stop on this port.
Start Triggers
From ON: Means Automatically Start
From FCS error: First FCS error seen triggers Capture Start
From payload error: First Payload error seen triggers Capture Start
Filter: First packet answering Filter condition triggers Capture Start
Stop Triggers
Until full: Means Automatically stop when buffer full
Until FCS error: First(/2nd) FCS error seen triggers Stop
Until payload error: First(/2nd)Payload error seen triggers Stop
Filter: First (/2nd) packet: answering Filter condition triggers Stop
Until User Stop: Capture will keep capturing FILO till manually stopped.
Which packets to keep (which will be left in capture buffer)
All: All packets are captured
With FCS error: Only FCS error frames
With payload error: Only payload error frames
Without test payload: Only non stream packets remain
With test payload: keeps only packets that are part of stream x(5) fill in the payload ID
Filter: keeps only packets answering Filter X conditions
Test payload ID to capture
Bytes to keep in capture buffer.
Save capture buffer as PCAP file.
Open Capture buffer with Wireshark
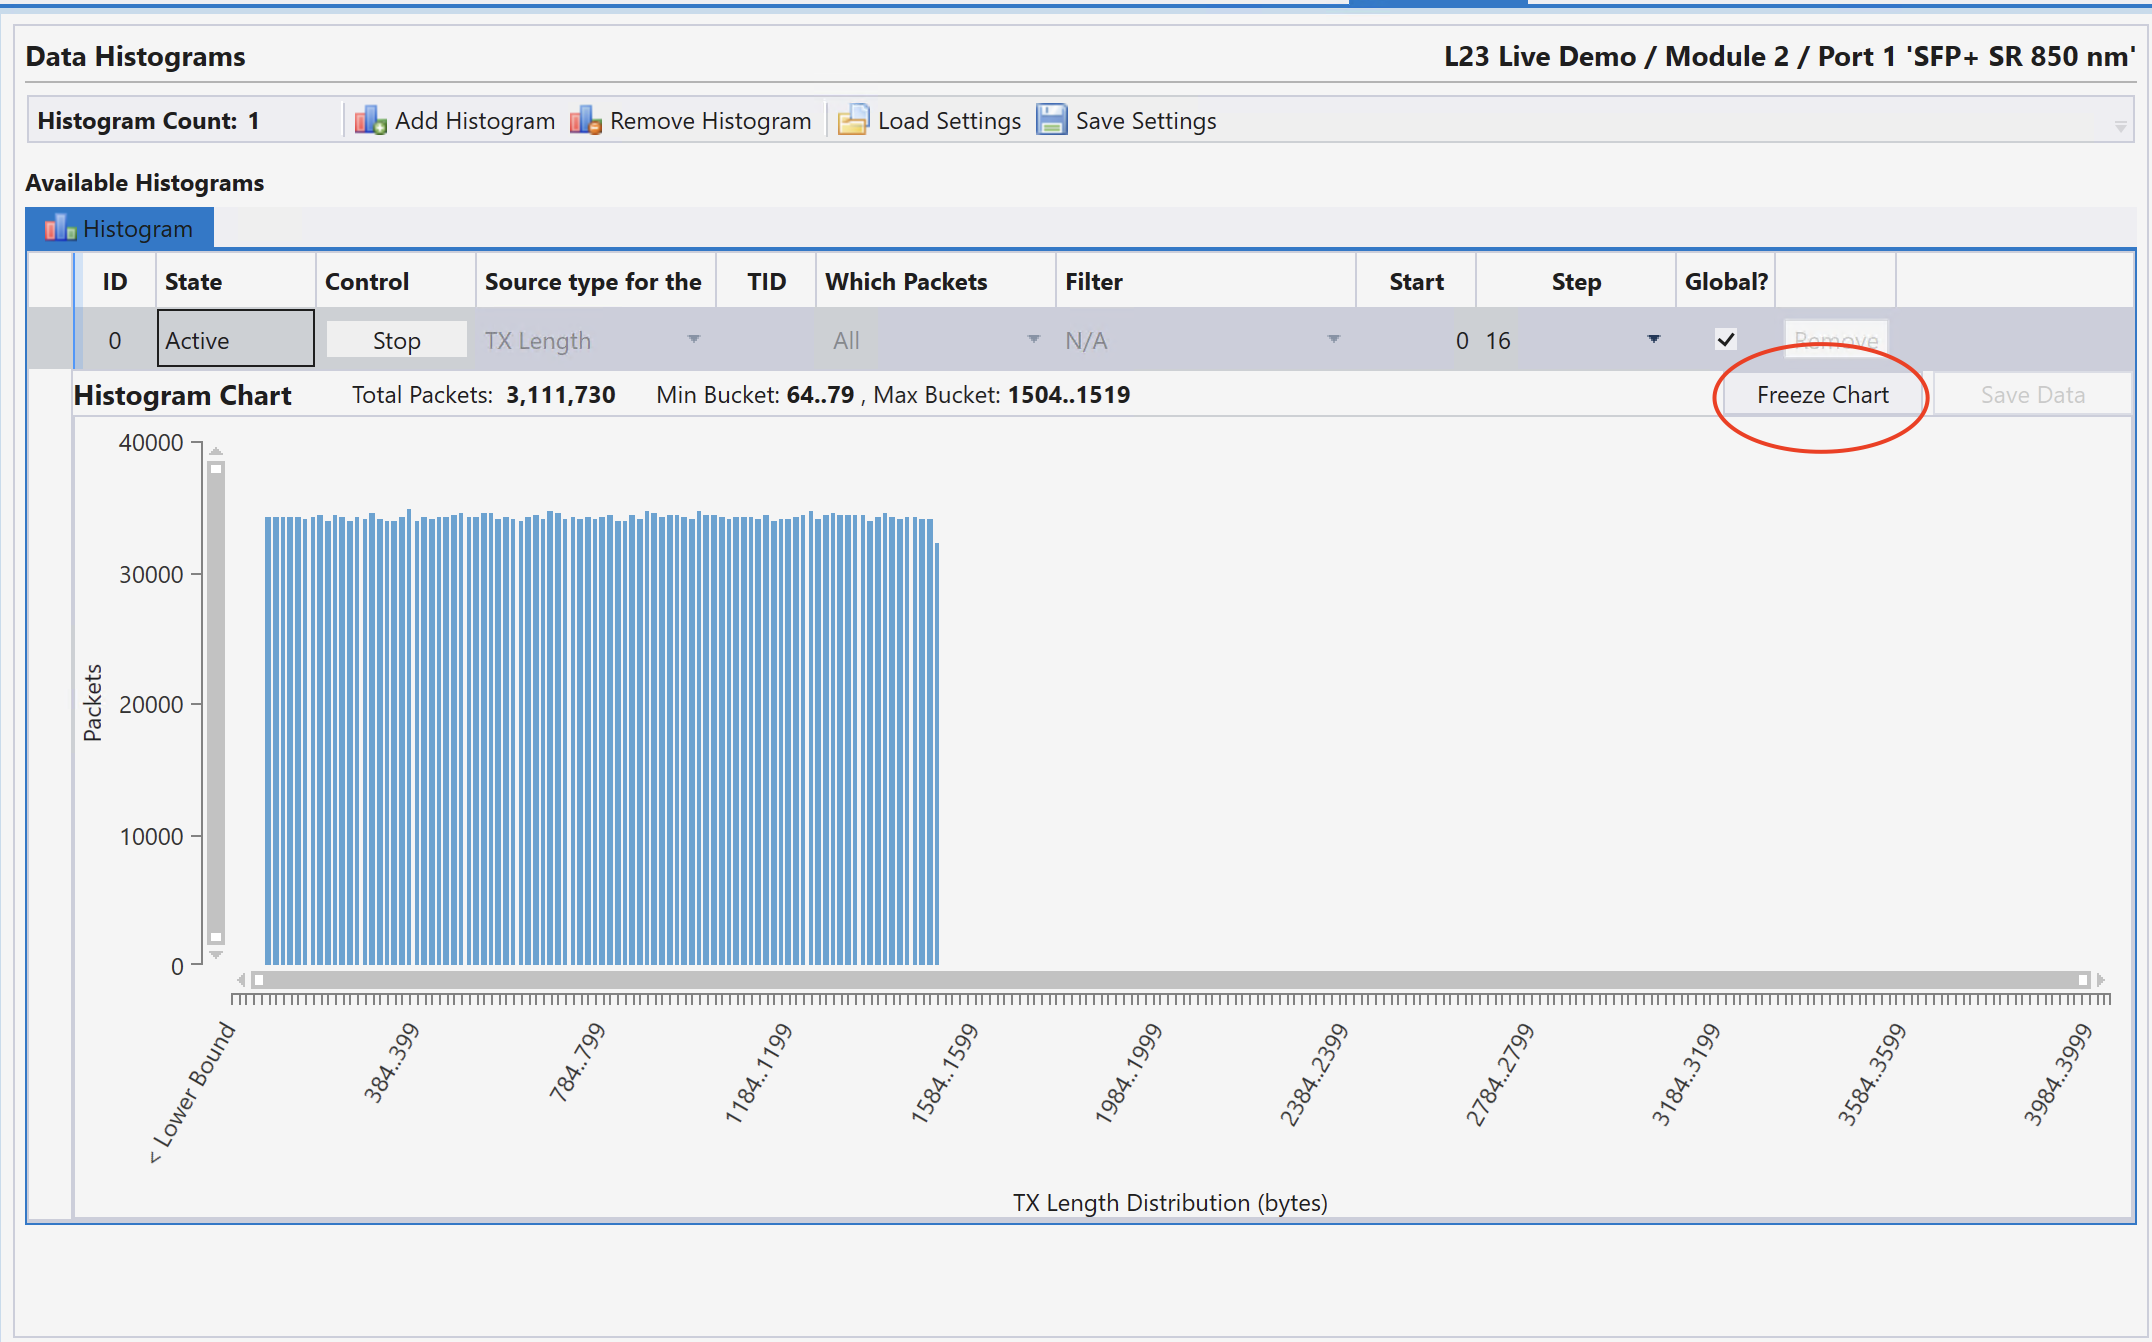
3.1.11. Histogram
Histograms are used to plot different distributions of values gathered over time e.g.
Tx/Rx Length (Packet size)
Rx Latency (Latency and Jitter may drift over time)
Rx Jitter
Rx IFG (an additional way of observing Jitter behavior)
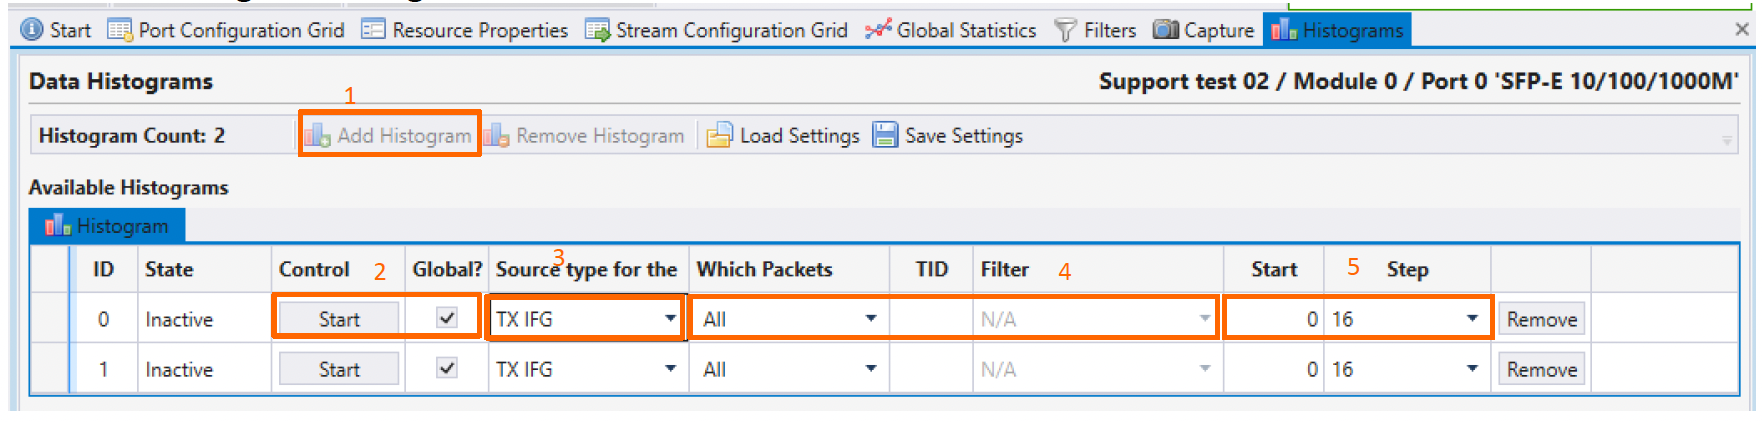
Add histogram - Multiple histograms can be run simultaneously.
Start Histogram - Start Manually or use checkbox to start from Global
Select the type of measurement you would like to track using the histogram.
Select which packets will be monitored by this histogram, either specific TID or packets answering a specific filter.
X-axis range choose the minimum offset and the resolution (step)
Use the Freeze button to freeze the view and enable the Save option.
3.1.12. Global Statistics
Go to the Global Statistics panel. You should now see your two test ports in the testbed in a grid view.
Press the Clear Counters button in the toolbar at the top of the panel to ensure that you start with a clean view.
Press the Start Traffic button to start traffic on all test ports in your testbed. You should now see the TX and RX traffic counters start to increment for both ports.
Press the Stop Traffic button to stop the traffic on both ports.
Note
The Global Statistics view will exclusively display ports and streams utilized by your current testbed. If you need to briefly examine the statistics counters for a different port, you can utilize the single-resource Port Statistics panel. This panel will provide statistics for the currently selected port, regardless of whether it is part of your testbed or not.
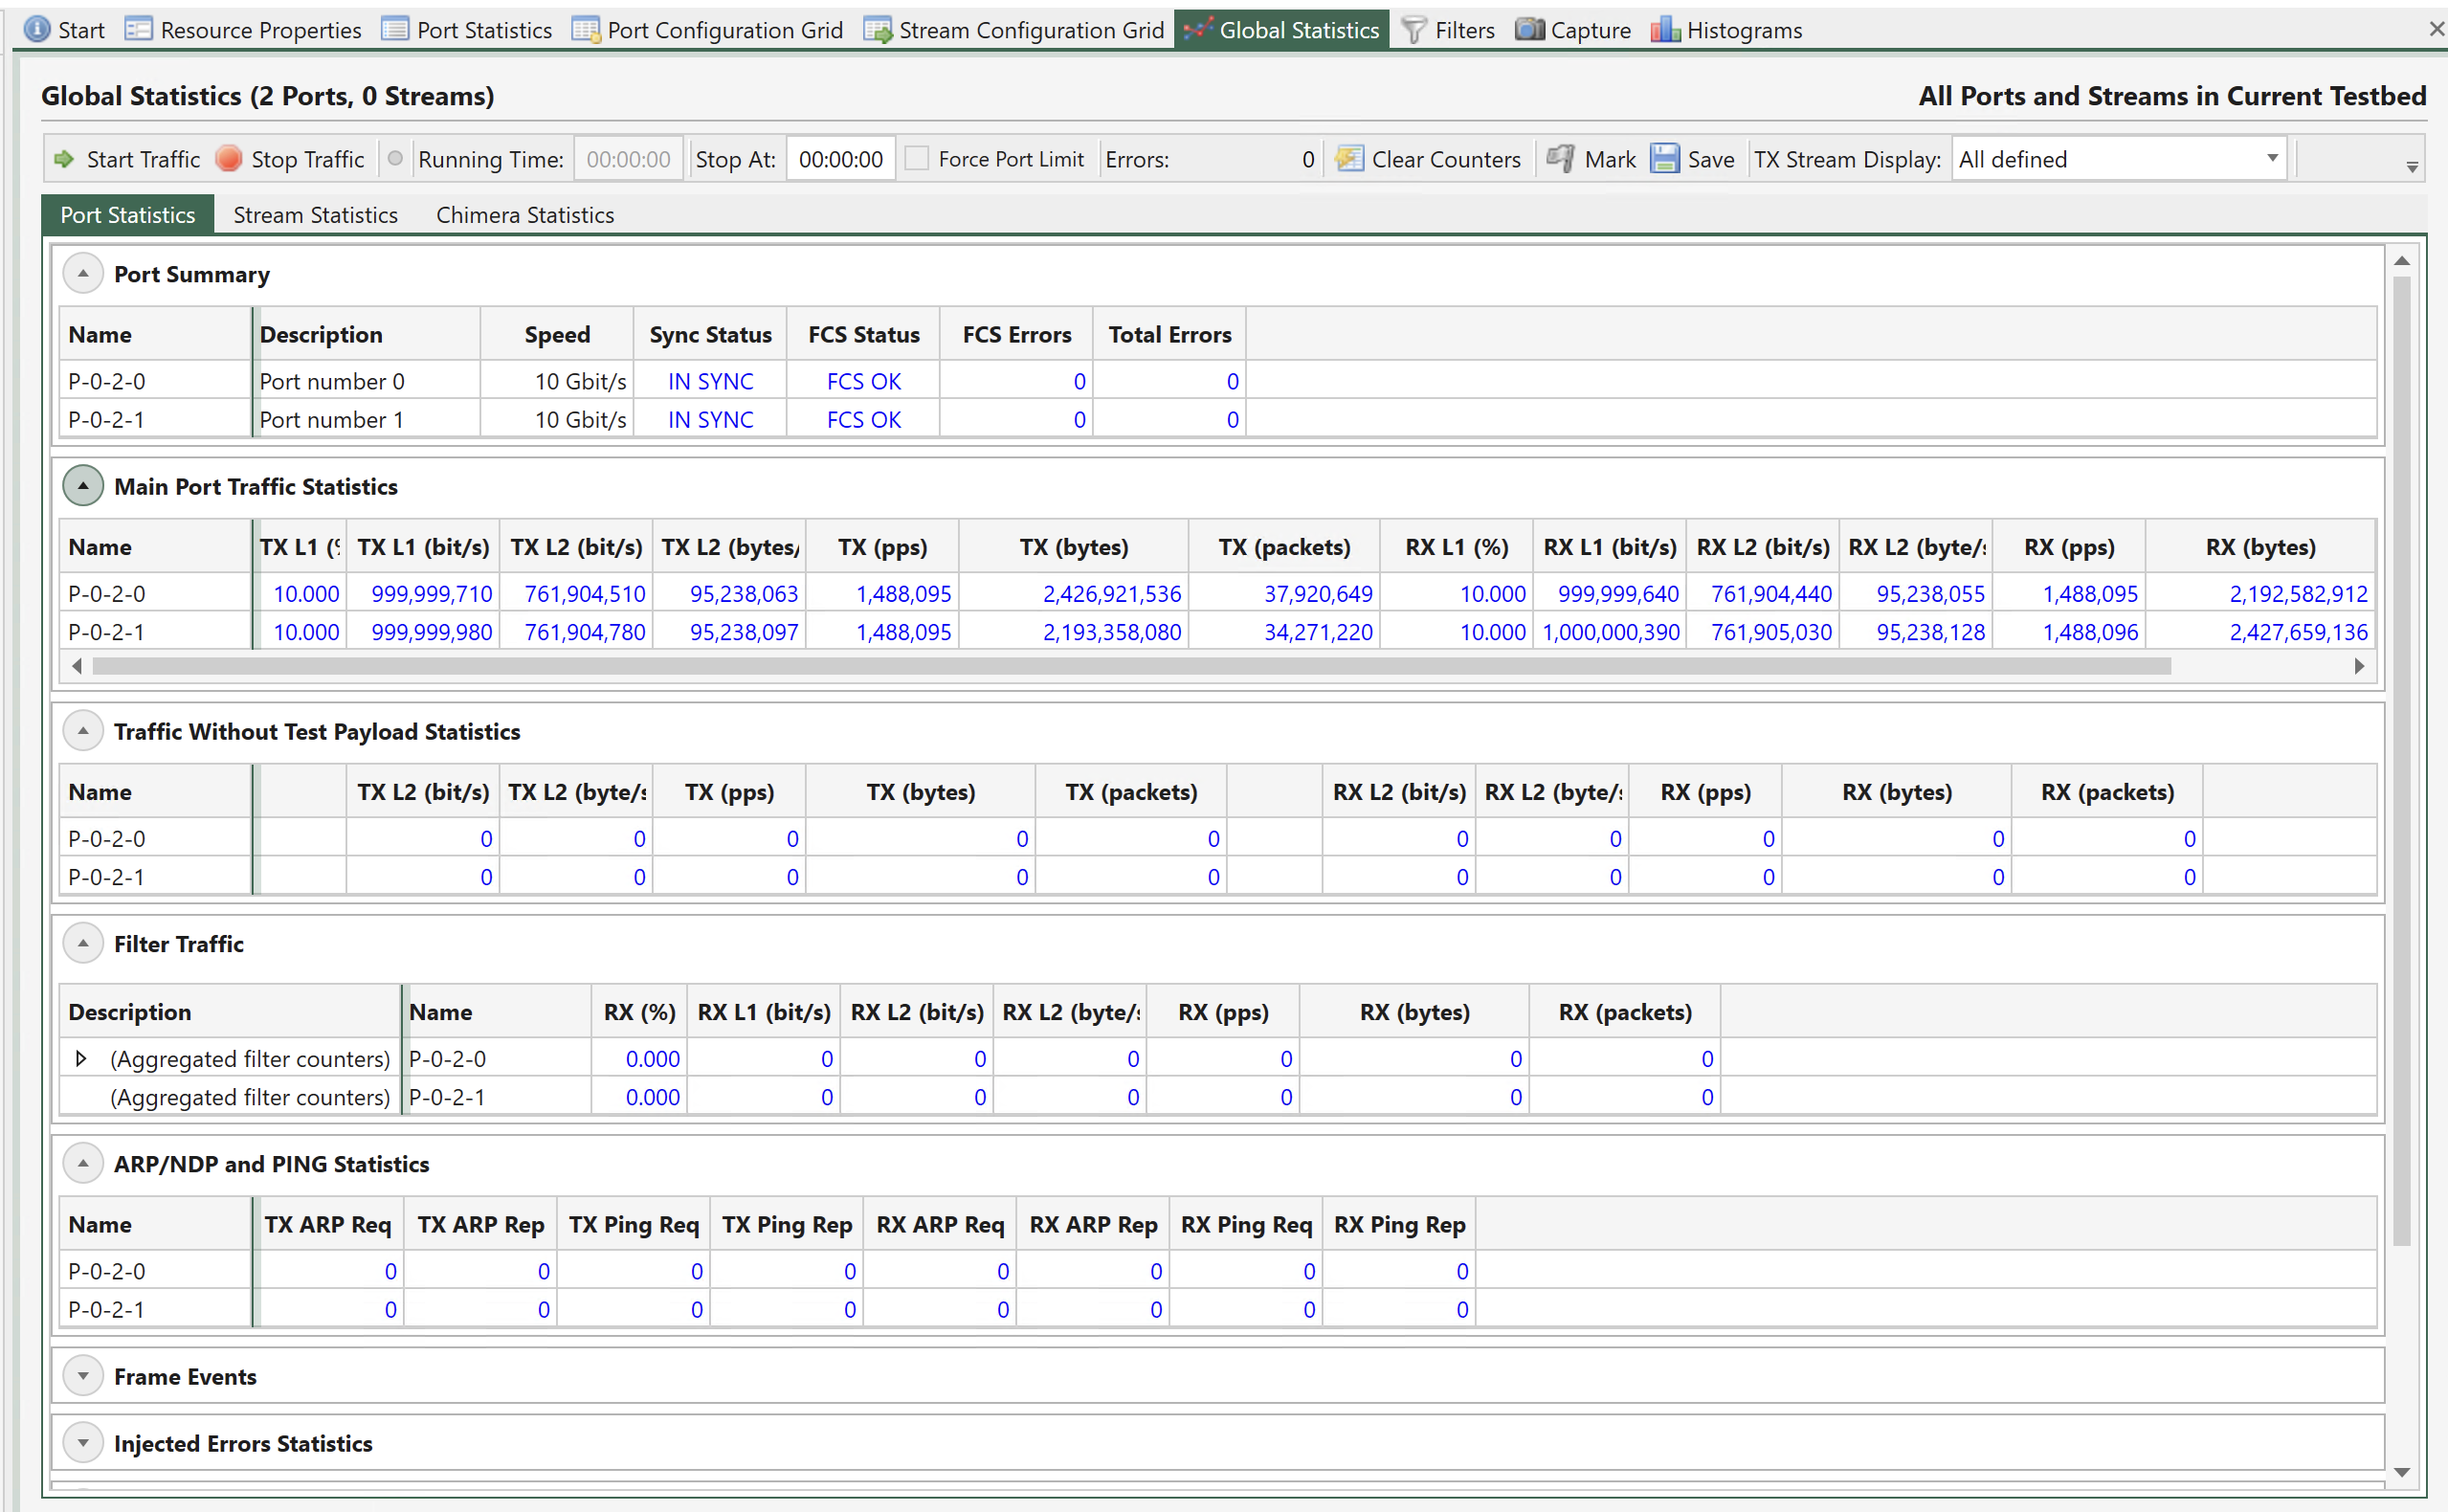
Fig. 3.21 Global statistics - port statistics
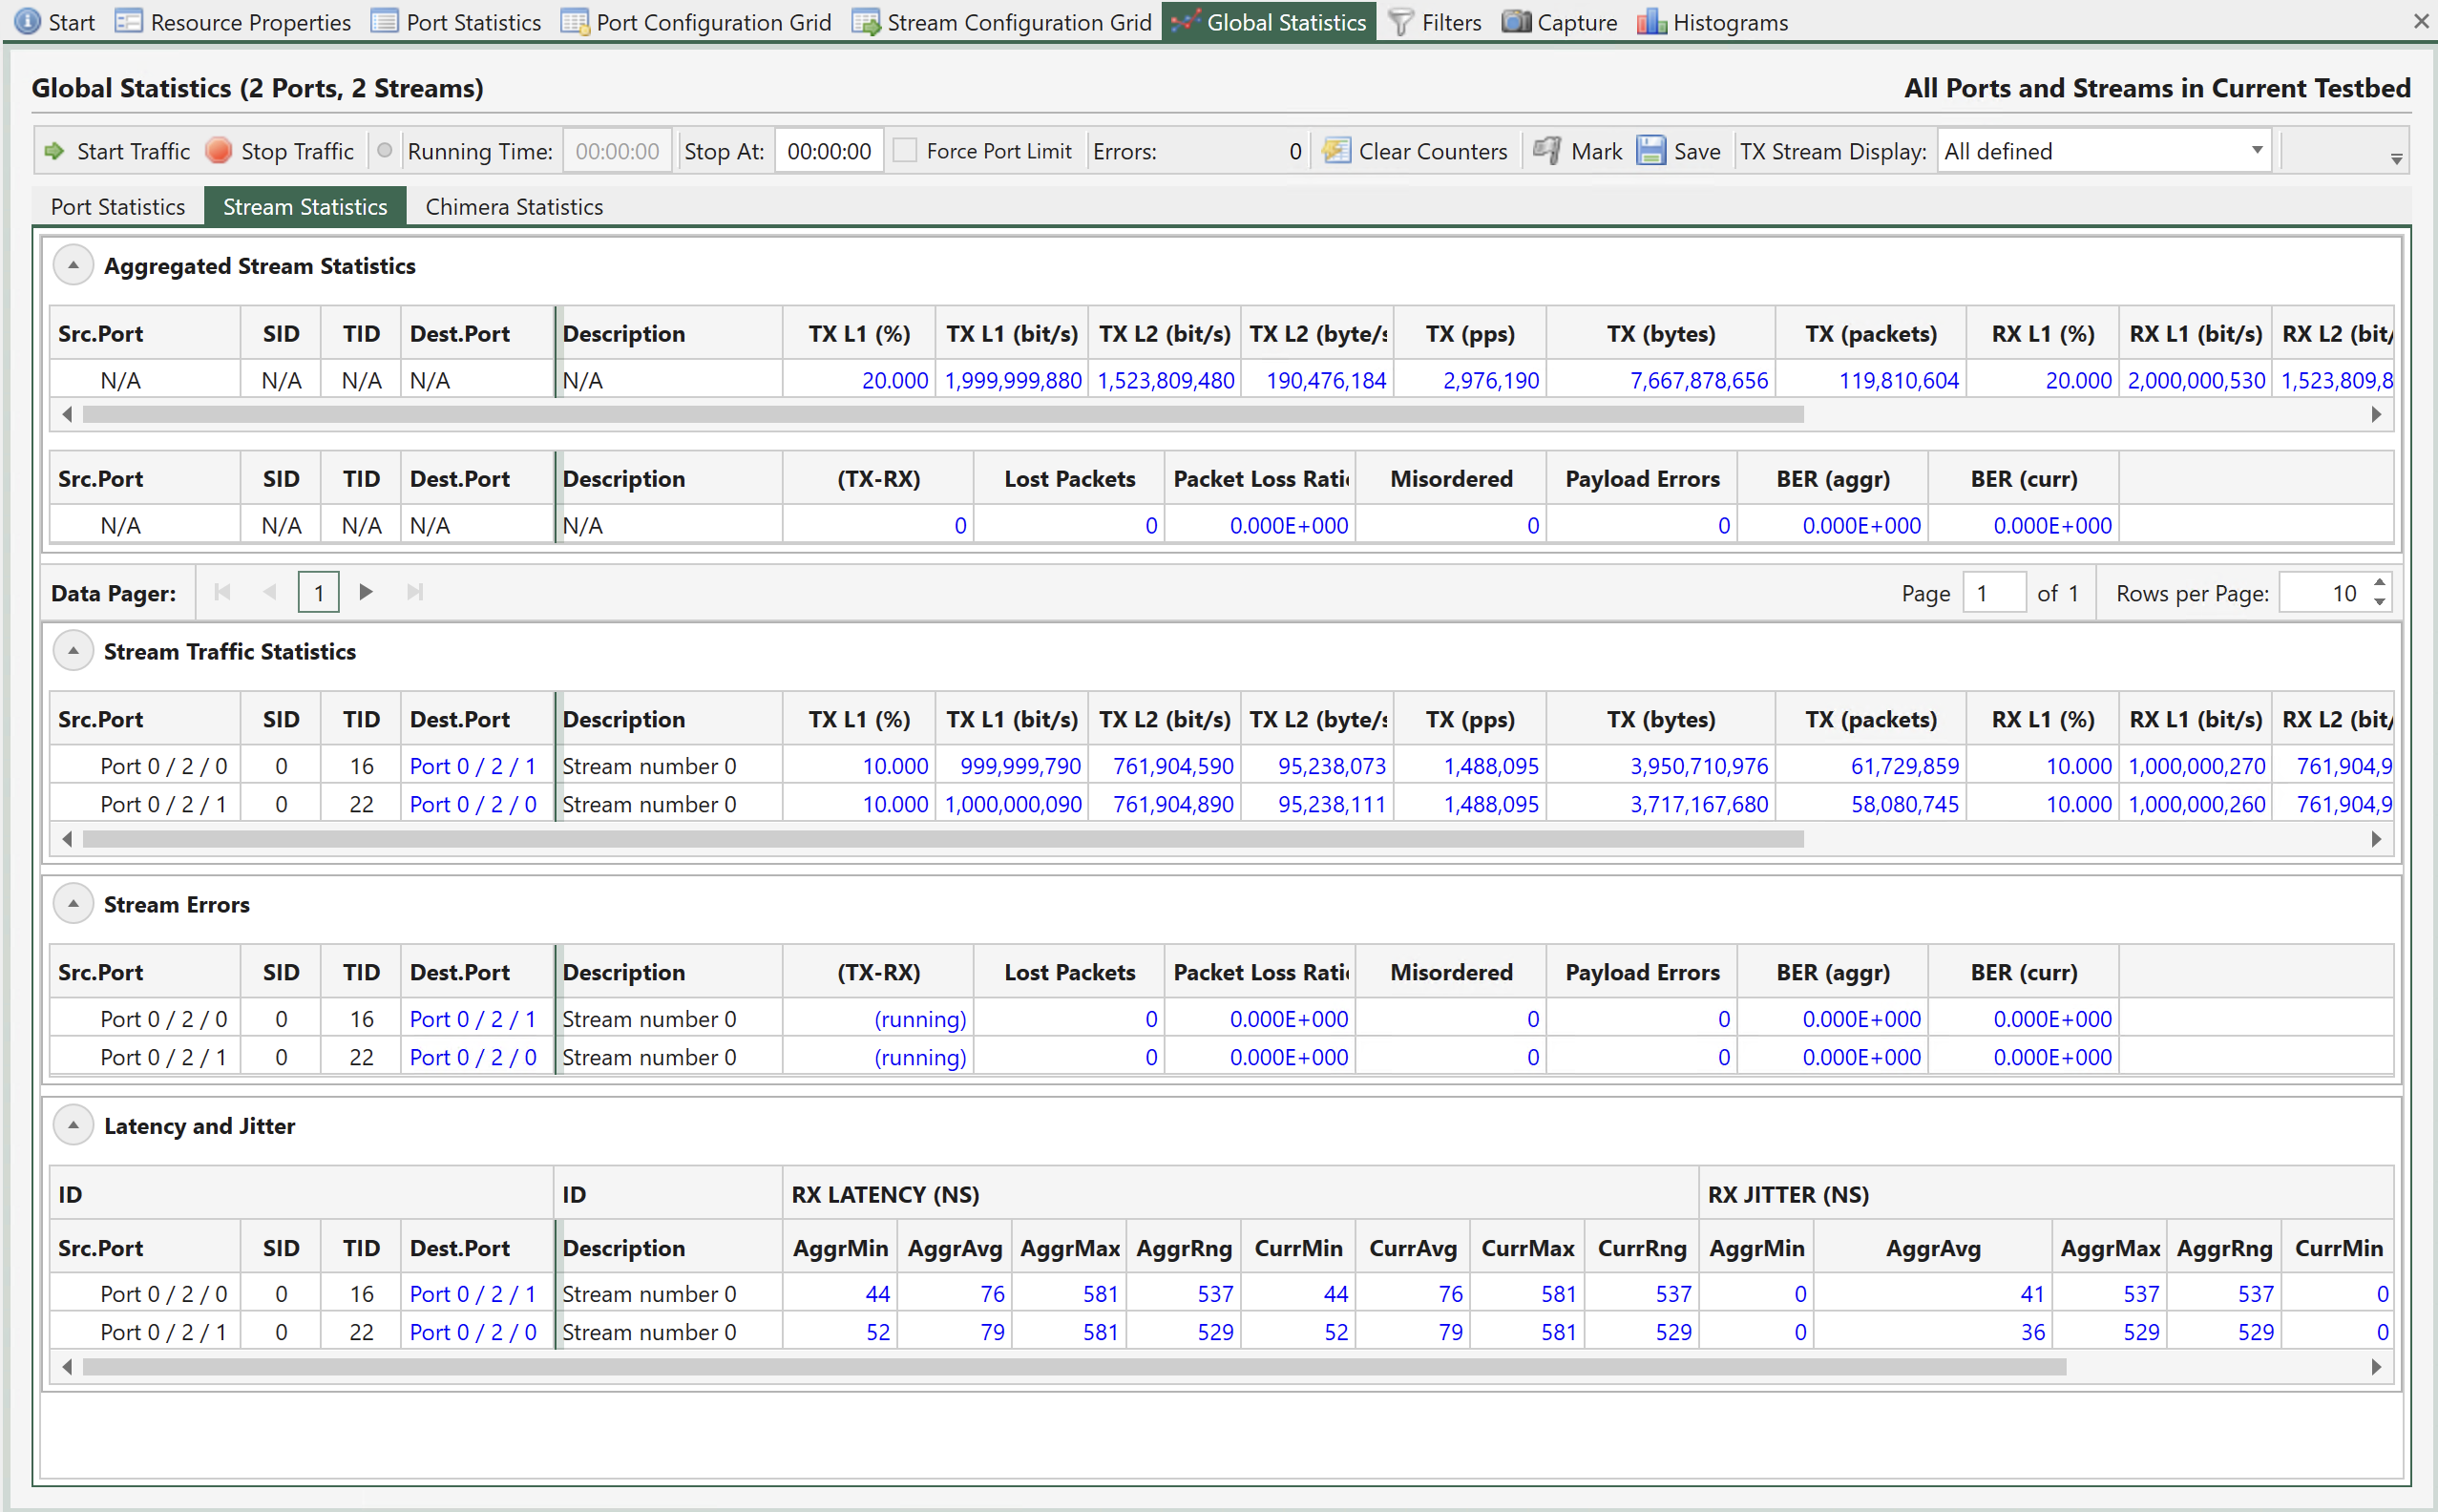
Fig. 3.22 Global statistics - stream statistics
Note
(TX-RX) packets gives packet loss results based on TX packets and RX packets.
RX packets can consist of two parts: RX_1 originated from the TX port, RX_2 duplicated by the DUT
(TX-RX) > 0:TX > RX_1+RX_2. Transmitted packets more than received even if there is duplication from the DUT.
(TX-RX) = 0:TX-RX_1 = 0, andRX_2 = 0. All transmitted packets are correctly received, and there is no duplication introduced by the DUT.TX-RX_1 = d, butRX_2 = d. Some transmitted packets are not received but the duplications by DUT cancels out the difference, where d is positive.
(TX-RX) < 0:TX-RX_1 = 0,RX_2 > 0. There is duplication from the DUT.TX-RX_1 = d,RX_2 > d. Duplication from the DUT is large than the lost, where d is positive
Lost Packets
Given that RX can consist of two parts as mentioned above, we cannot be certain about the TX-RX_1. Consequently, we need use the sequence numbers in the packets to calculate “the holes in the sequence”. For example, when the TX sends #0,#1,#2,#3,#4,#5,#6, but #3 is not received by the RX, then TX-RX_1 = 1. But if #3 is not truly lost but is delayed by the DUT and later received by the RX, the TX-RX_1 will be back to 0.
TX: #0,#1,#2,#3,#4,#5,#6 RX: #0,#1,#2,#4,#5,#6 (Lost Packets = 1) (after a while…) RX: #3 (Lost Packets = 0)
Unfortunately, there is no one mechanism that can handle both scenarios at the moment.
3.1.13. Logging and Reporting
Enable Counter Logging - in order to save results over time and record all results for each second that passes. Enable Generate Report - in order to generate a report of accumulated results.
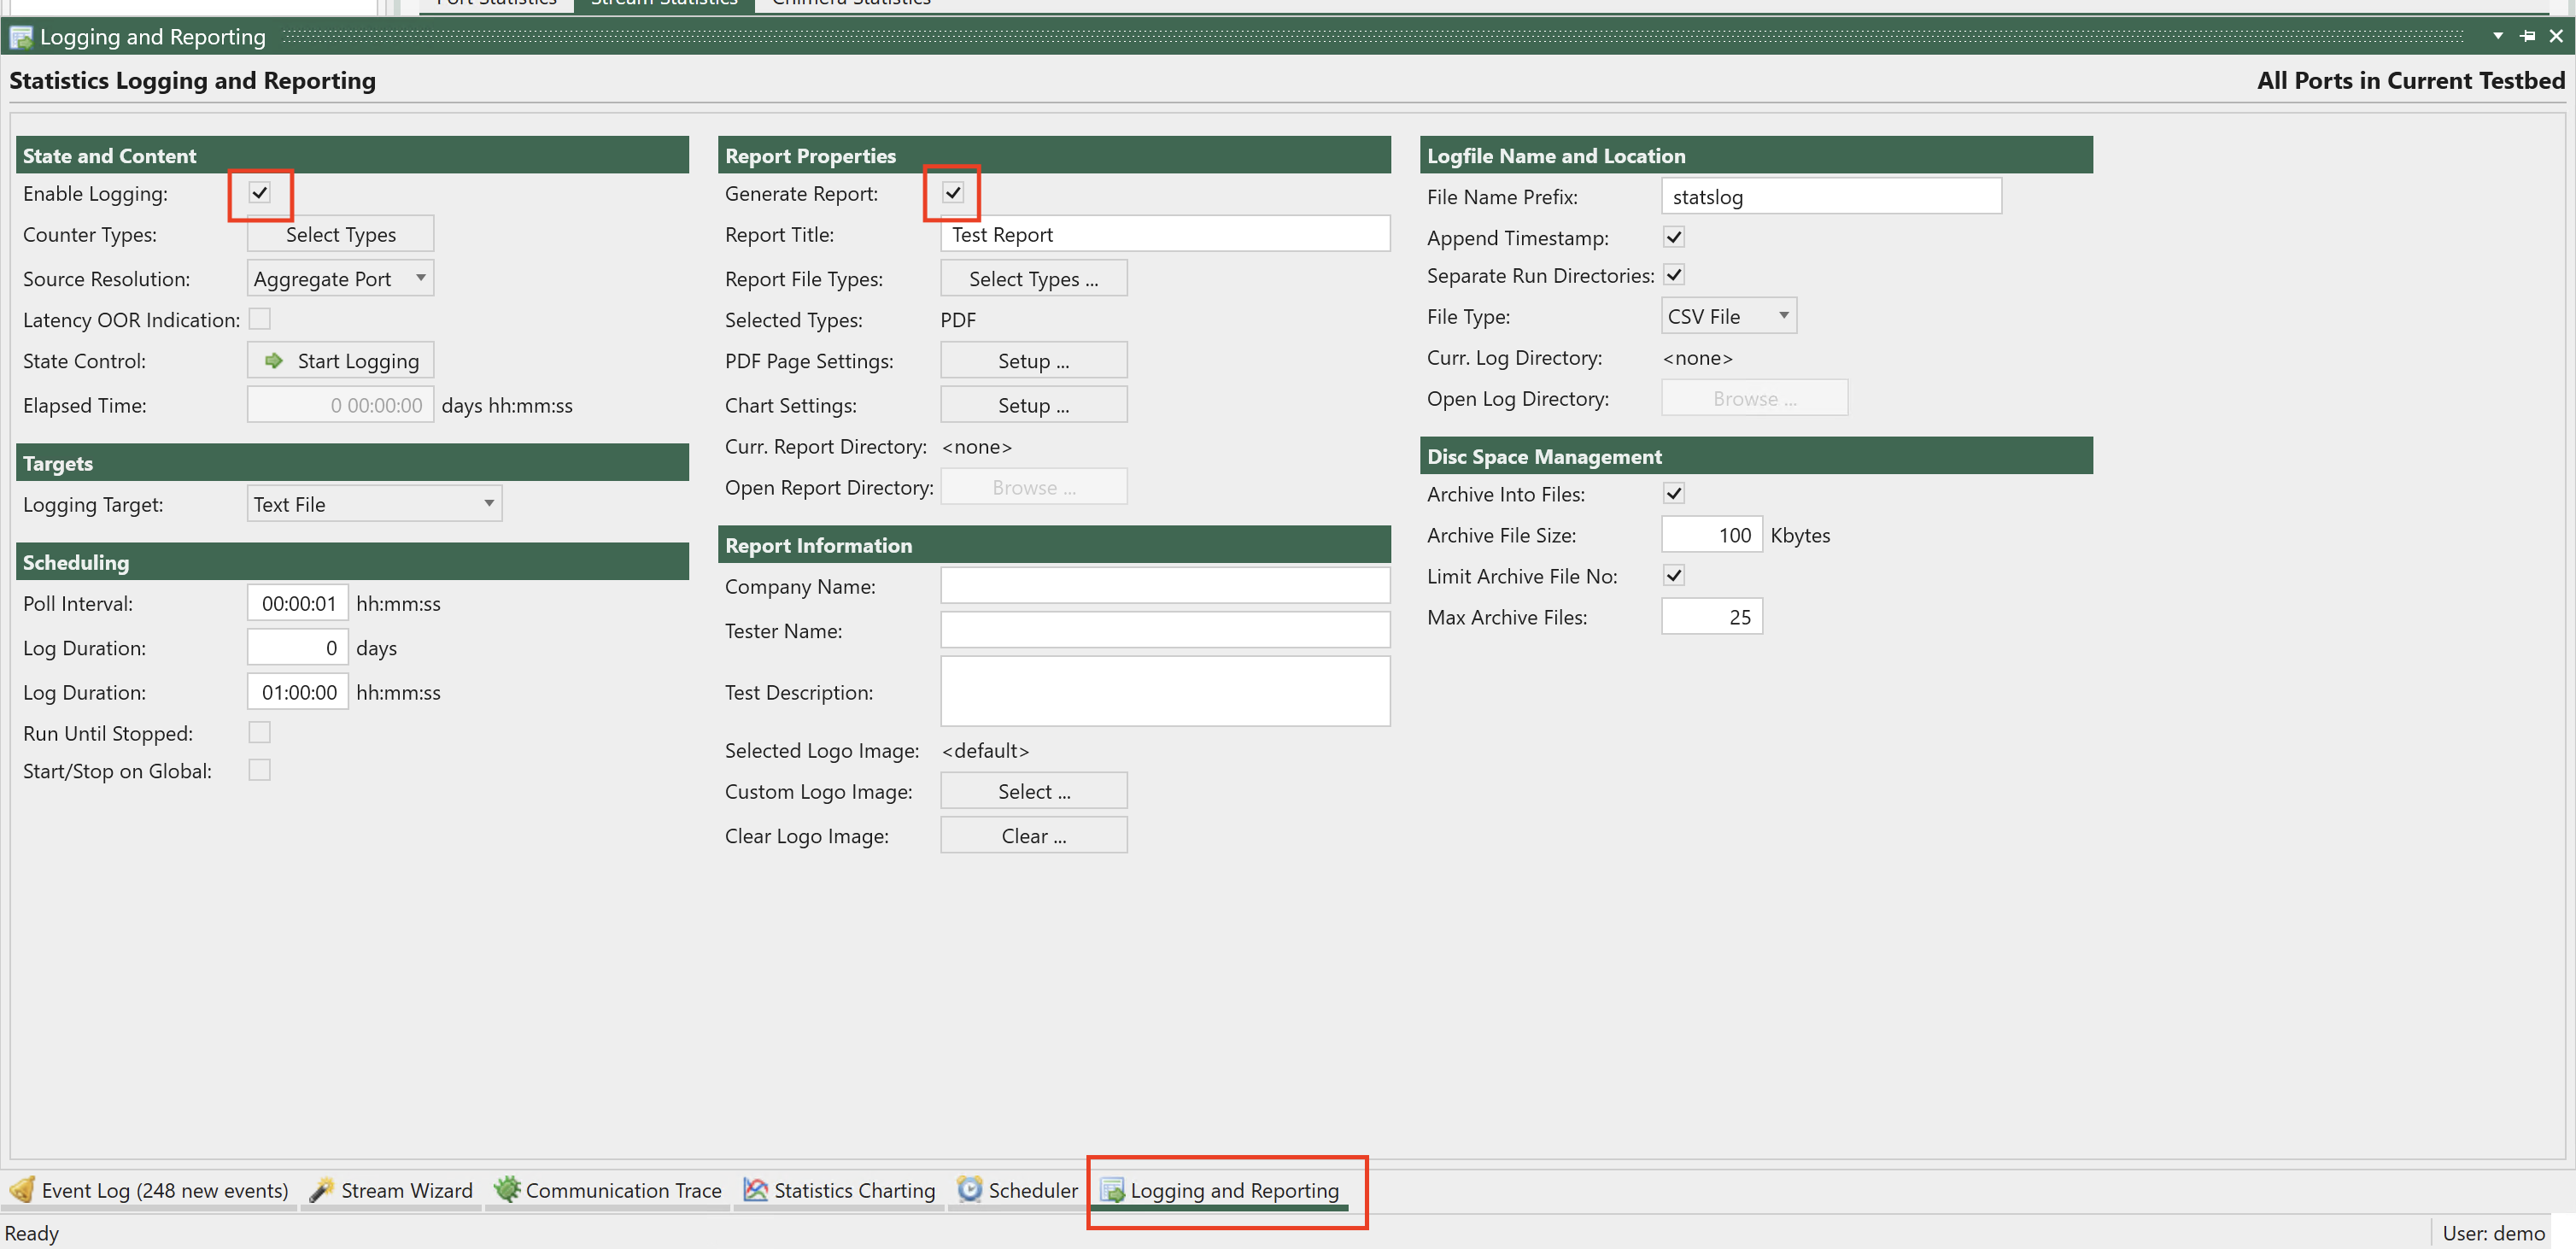
Click Select Types, and select the counters you want to record and/or include in the report
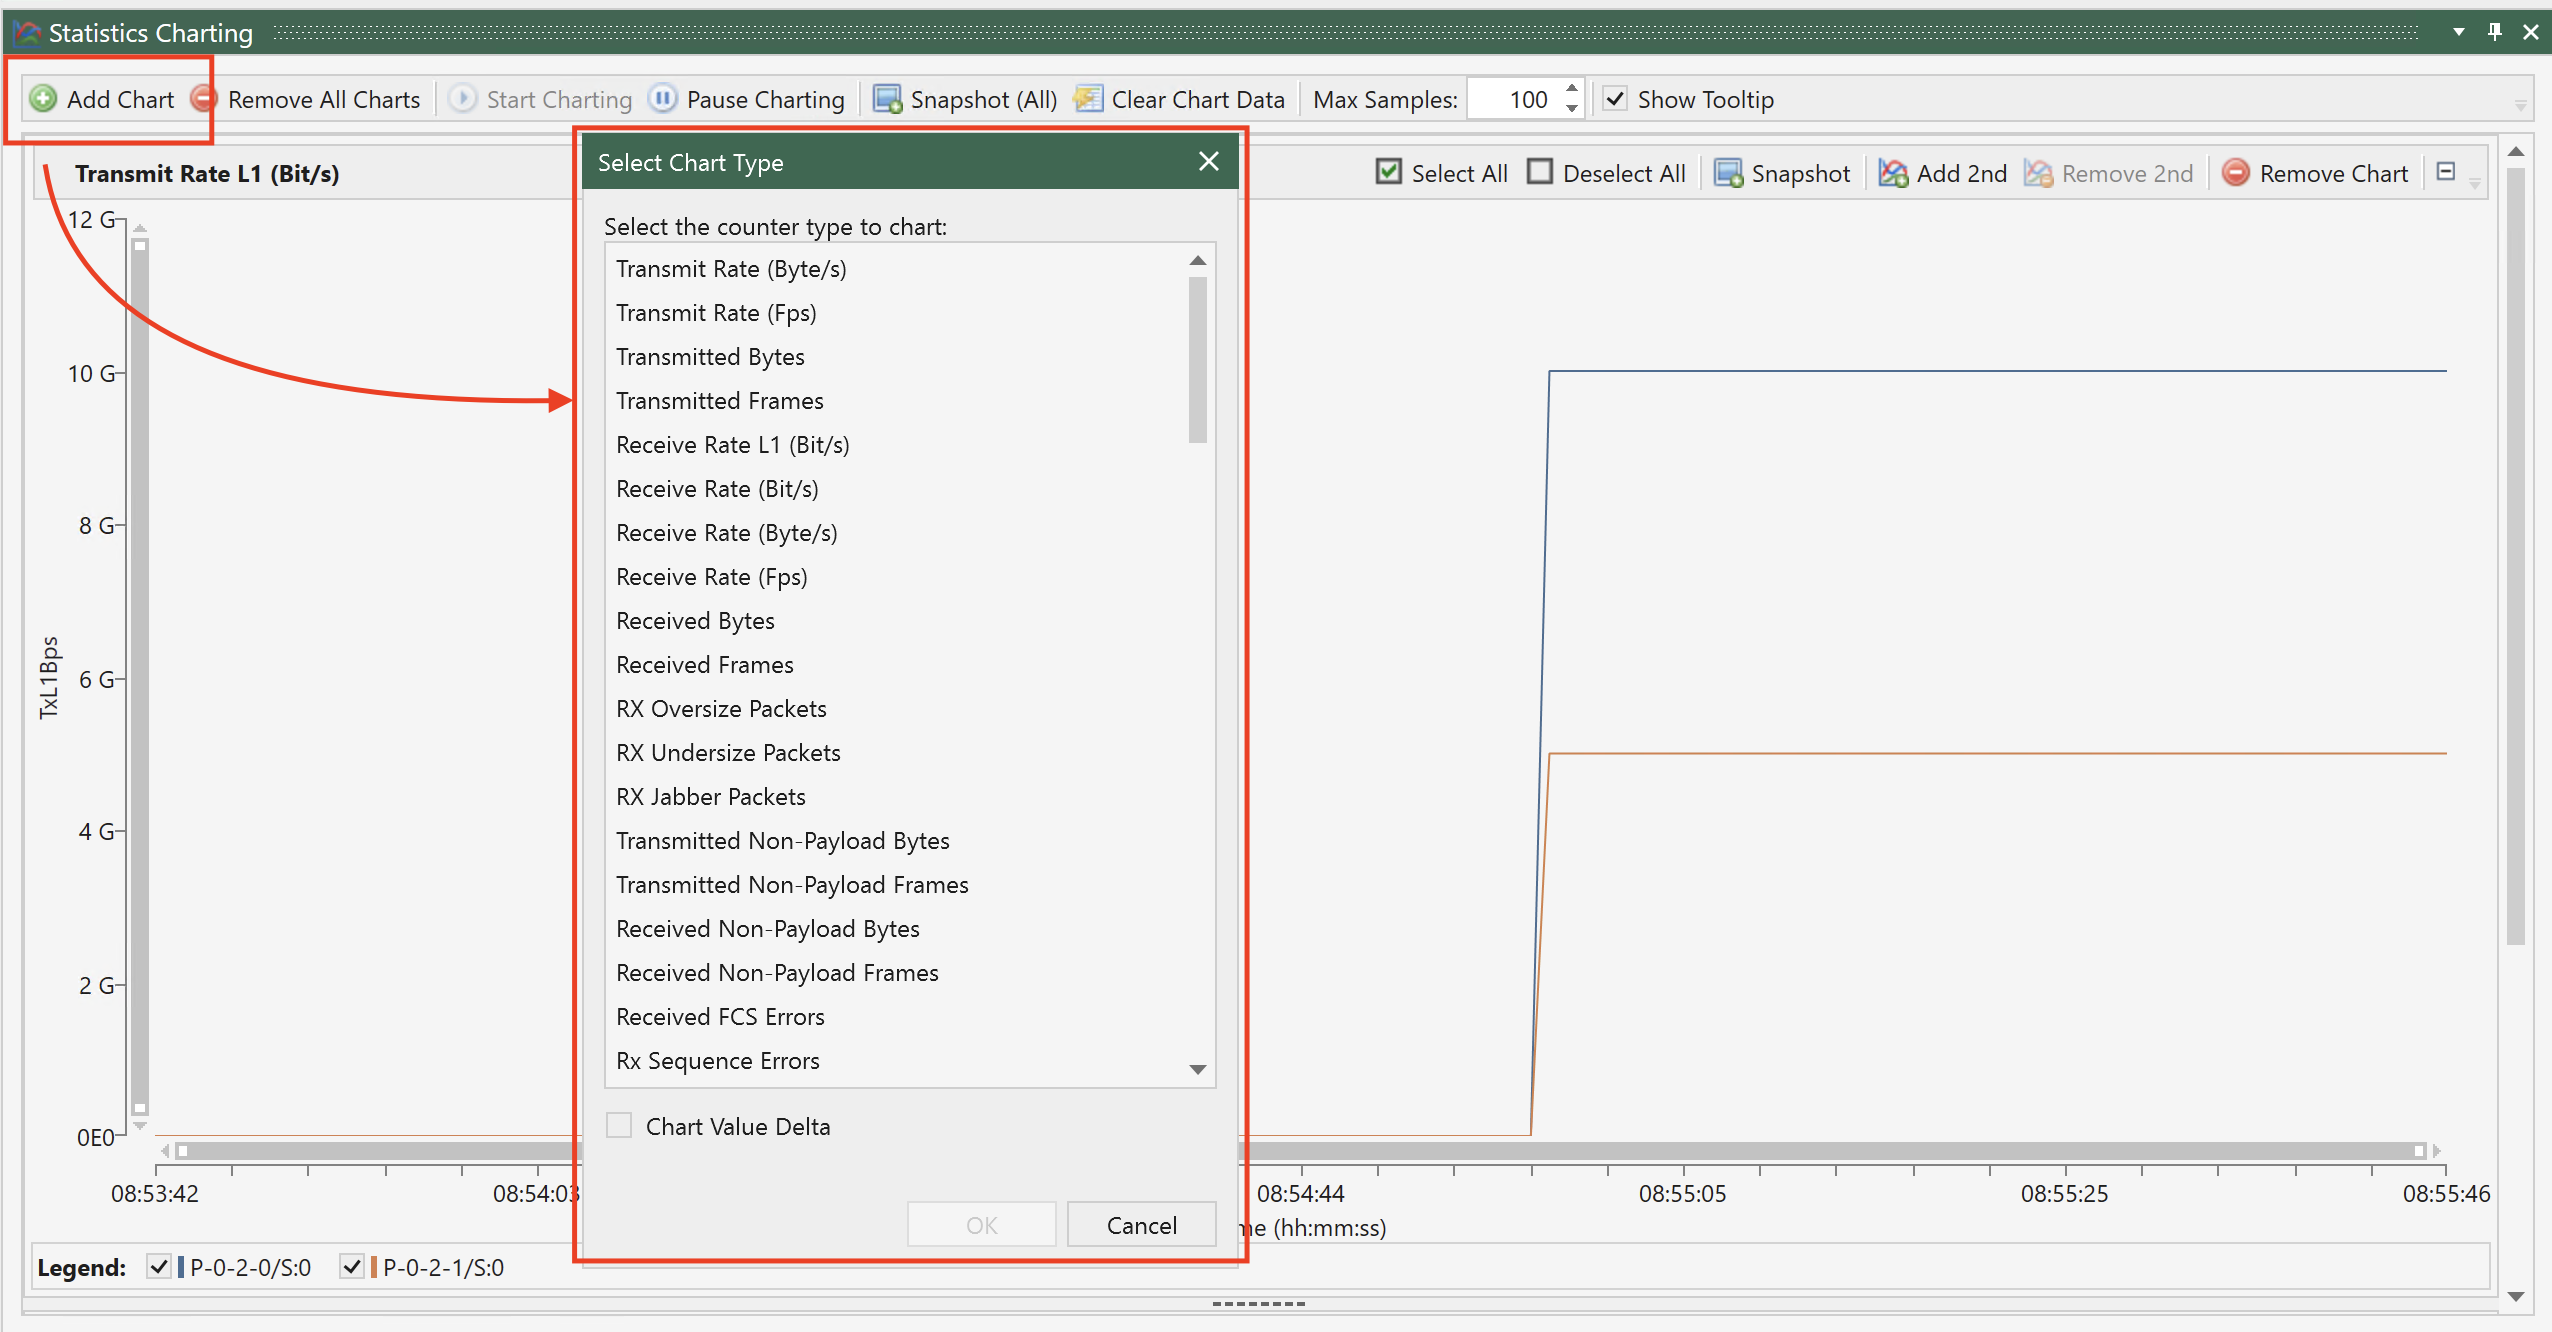
3.1.14. Statistics Charting
Click Add Chart and select the chart types you want. Then click Start Charting.
3.2. Getting Started with Network Impairment
This section is intended to guide you in using XenaManager to initiate a basic traffic impairment scenario for network impairment.
3.2.1. Configure Chimera Module
Description: In this field add a Module Description text
Port Configuration: Choose the port speed
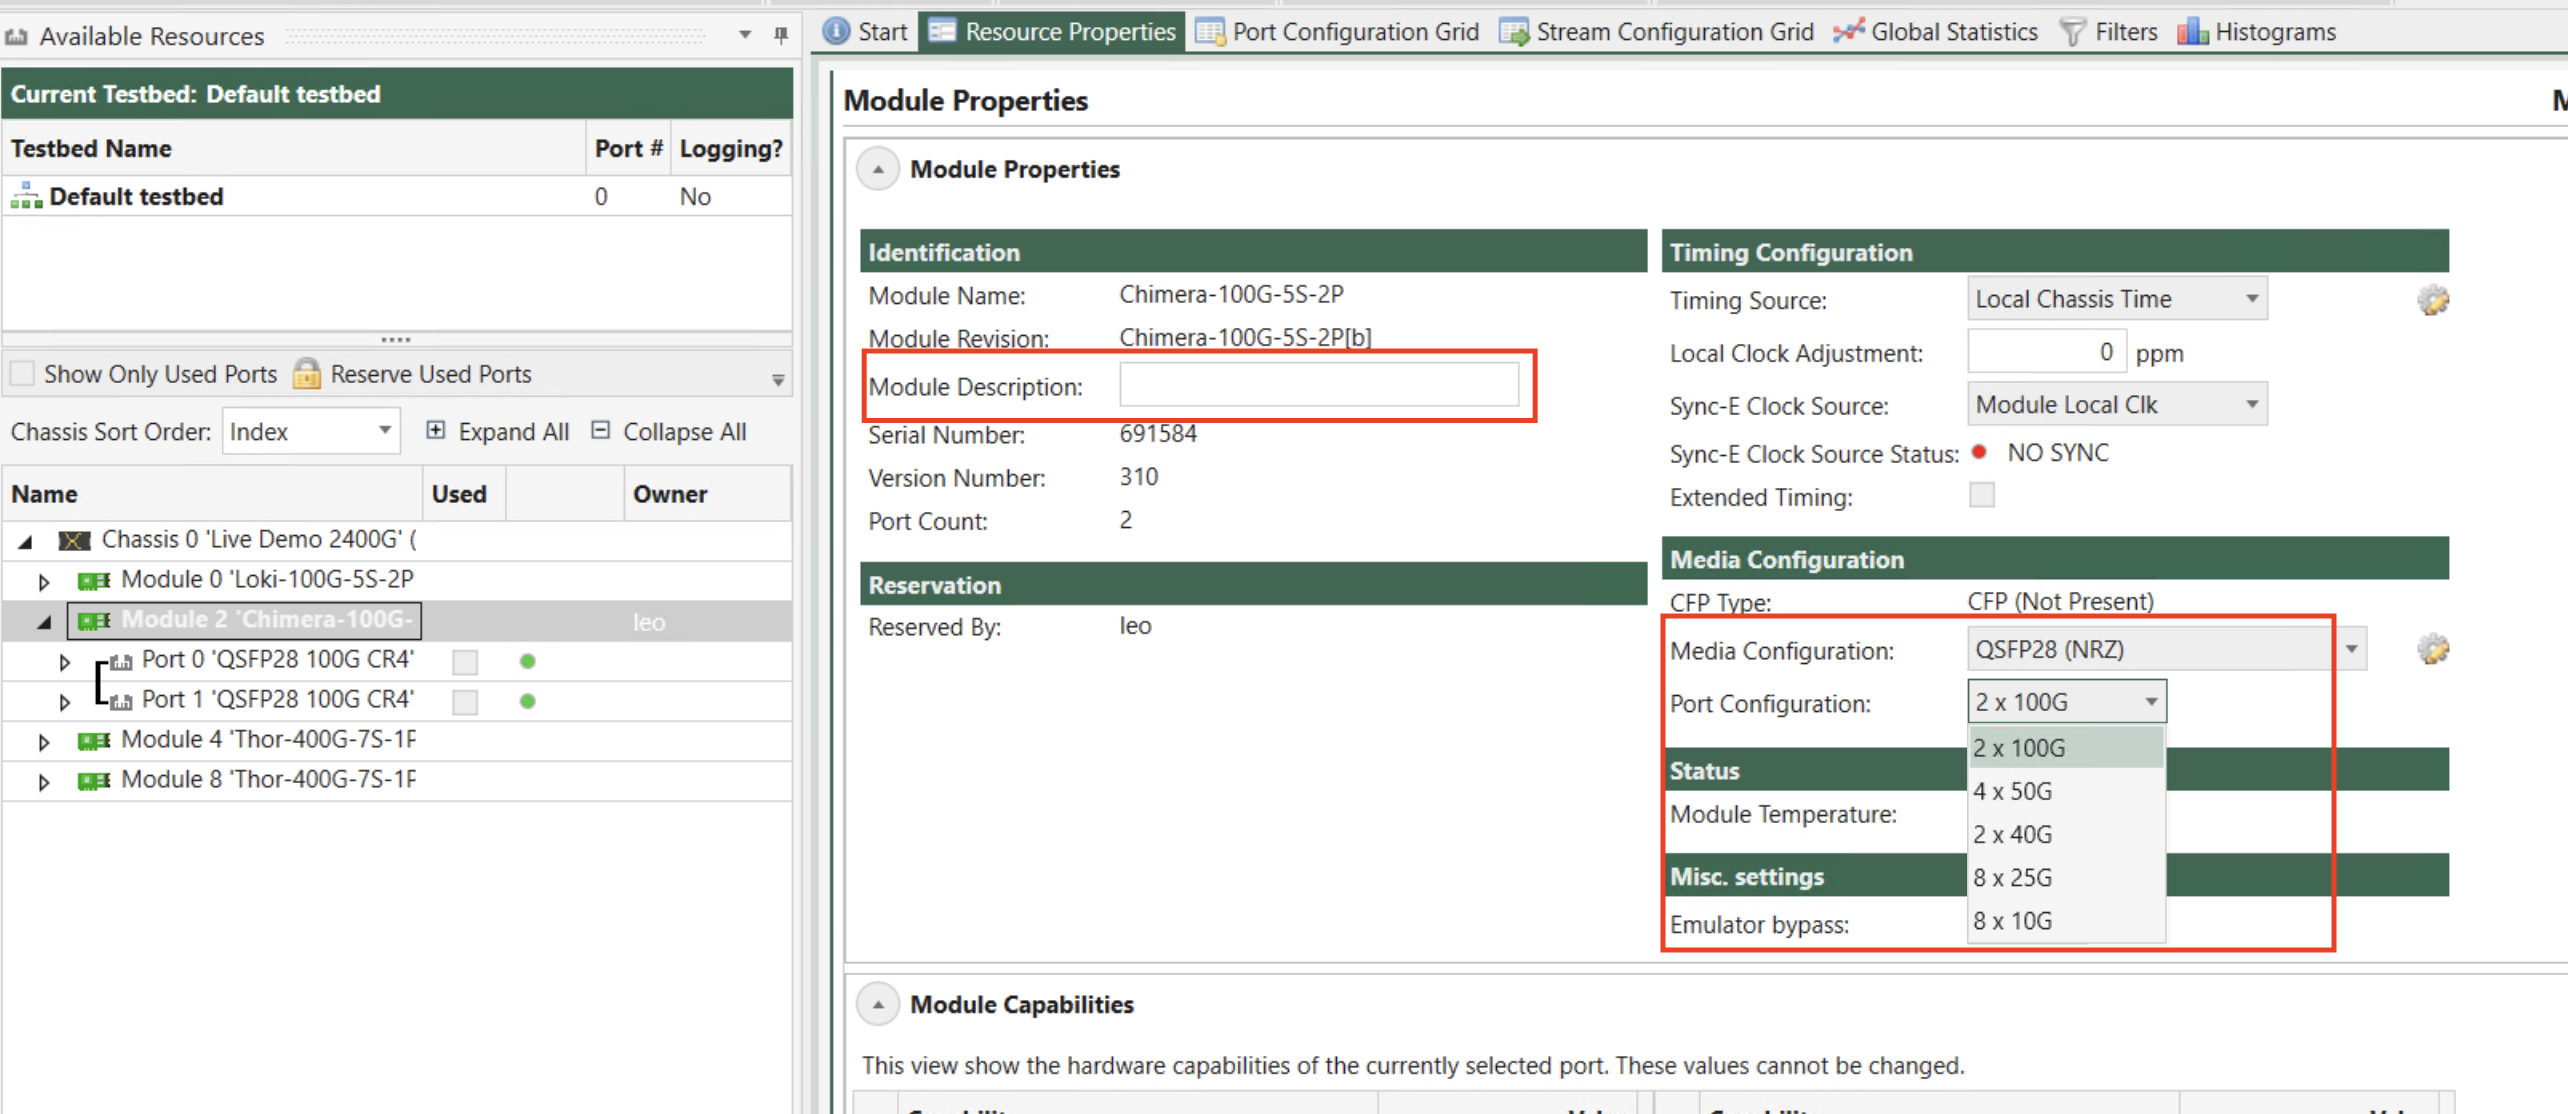
Fig. 3.23 Configure chimera module
3.2.2. Add Chimera Port
Select the port(s) you want to use.
Click Reserve Used Ports, check Show Only Used Ports
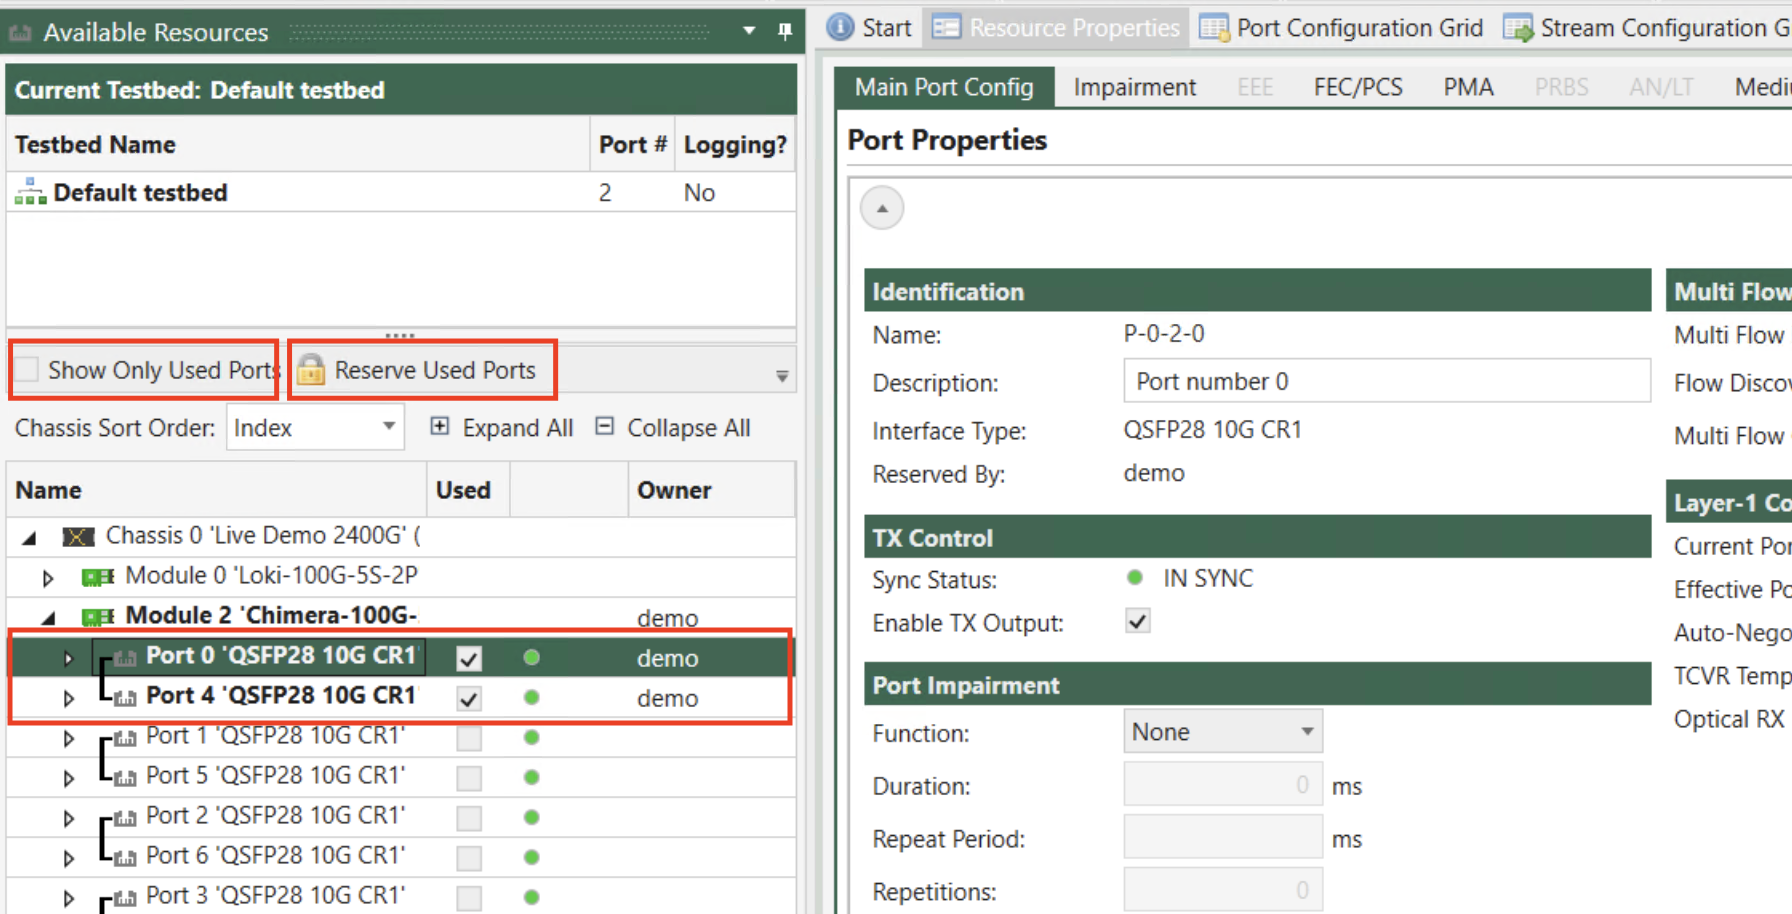
Fig. 3.24 Reserve ports
3.2.3. Enable Impairment
You need to enable impairment on the ingress port, where the traffic enters.
Click port
Go to Impairment Config tab.
Enable Enable Impairment. When you observe a green wave icon alongside the in-sync indicator, it indicates that the port is capable of performing impairments.
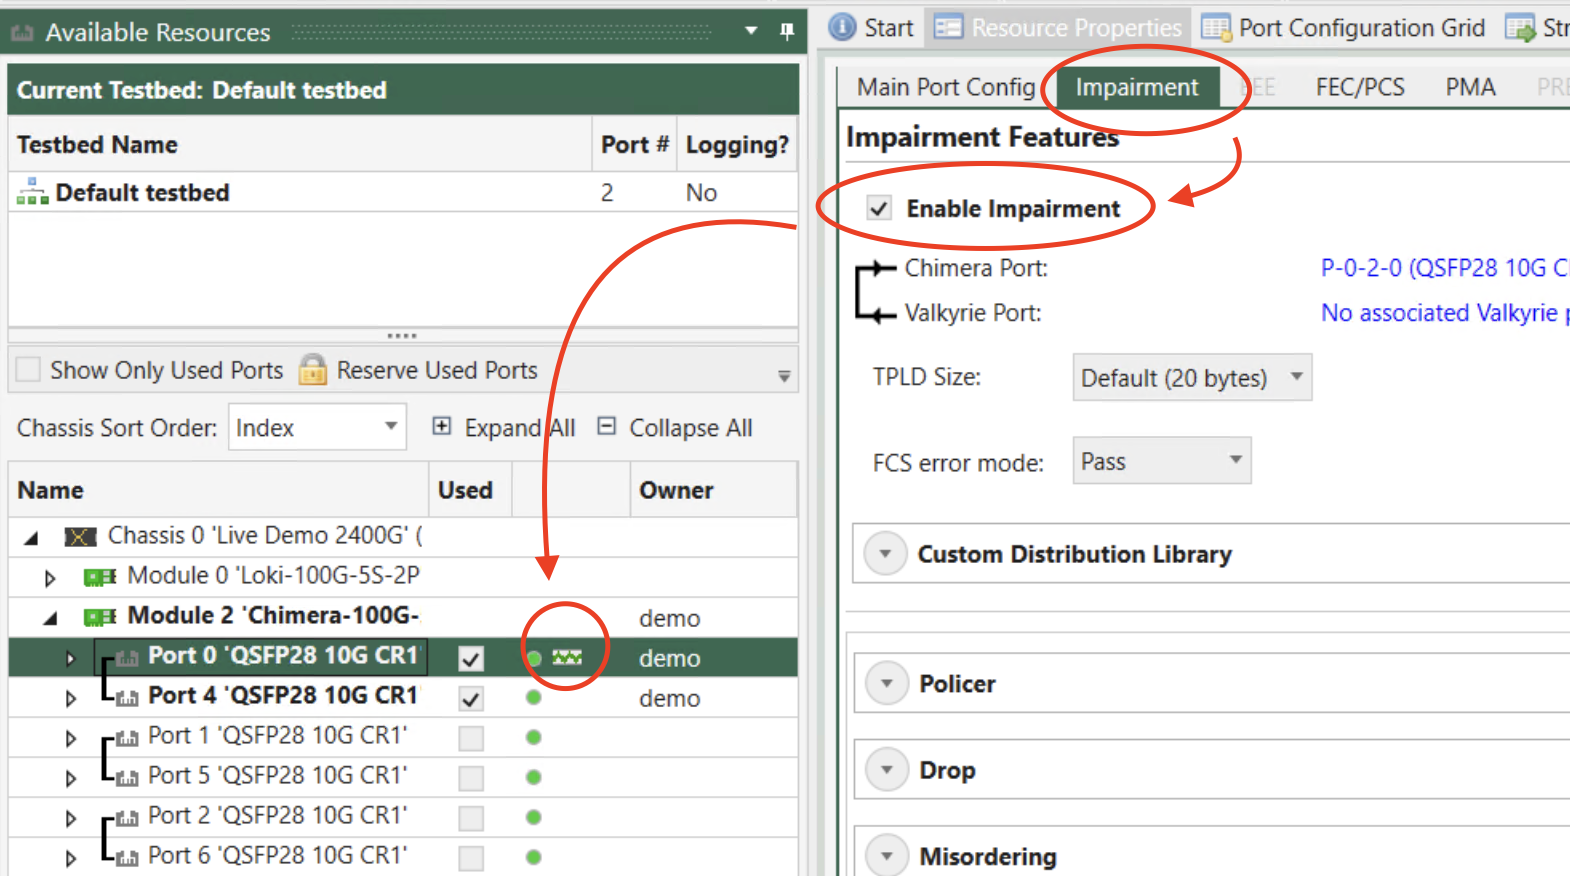
Fig. 3.25 Enable impairment on port
3.2.4. Configure Flow Filter
Let’s set up a flow to capture all frames containing a single VLAN tag with a value of 10. Here’s how you can configure it.
Expand a port and select Flow (1).
Change flow description to
VLAN 10. This helps you to identify the flow later.Enable the filter. This sets the filter in action.
Choose
1 VLAN Tagfor Layer 2+.Check Tag and enter
10in Value.Click Apply to apply the changes.
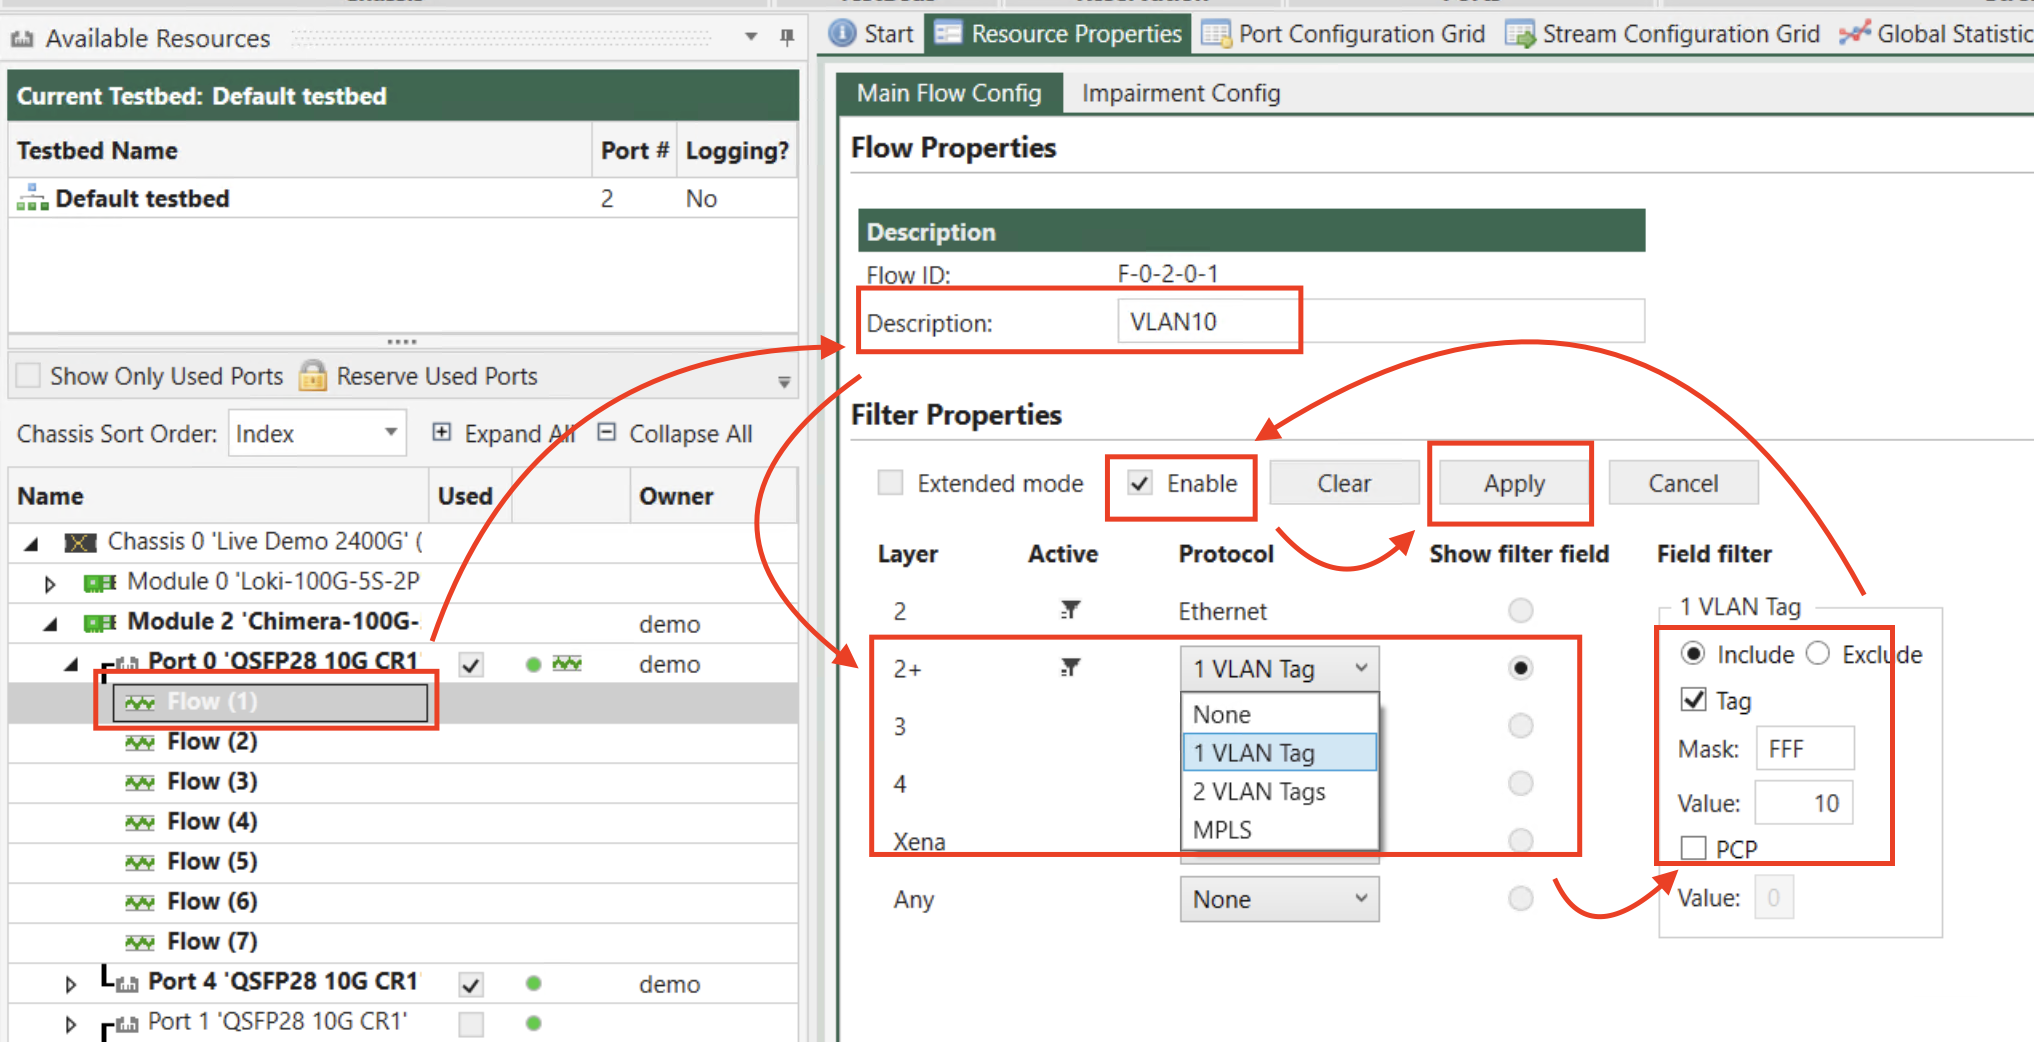
Fig. 3.26 Configure flow filter
3.2.5. Configure Flow Impairments
Now that we have a filter in place to capture all frames with a single VLAN tag carrying the value 10, we can proceed to discard 20 packets every 0.1 second from the filtered frames using the Drop function..
Select Impairment Config tab.
Expand Drop and choose
Fixed Burstin Distribution.Choose
Repeatin Scheduling and enter0.1in Repeat Period.Enter
20in Burst Size.Click Apply to apply the changes.
Click Start to start the impairment.
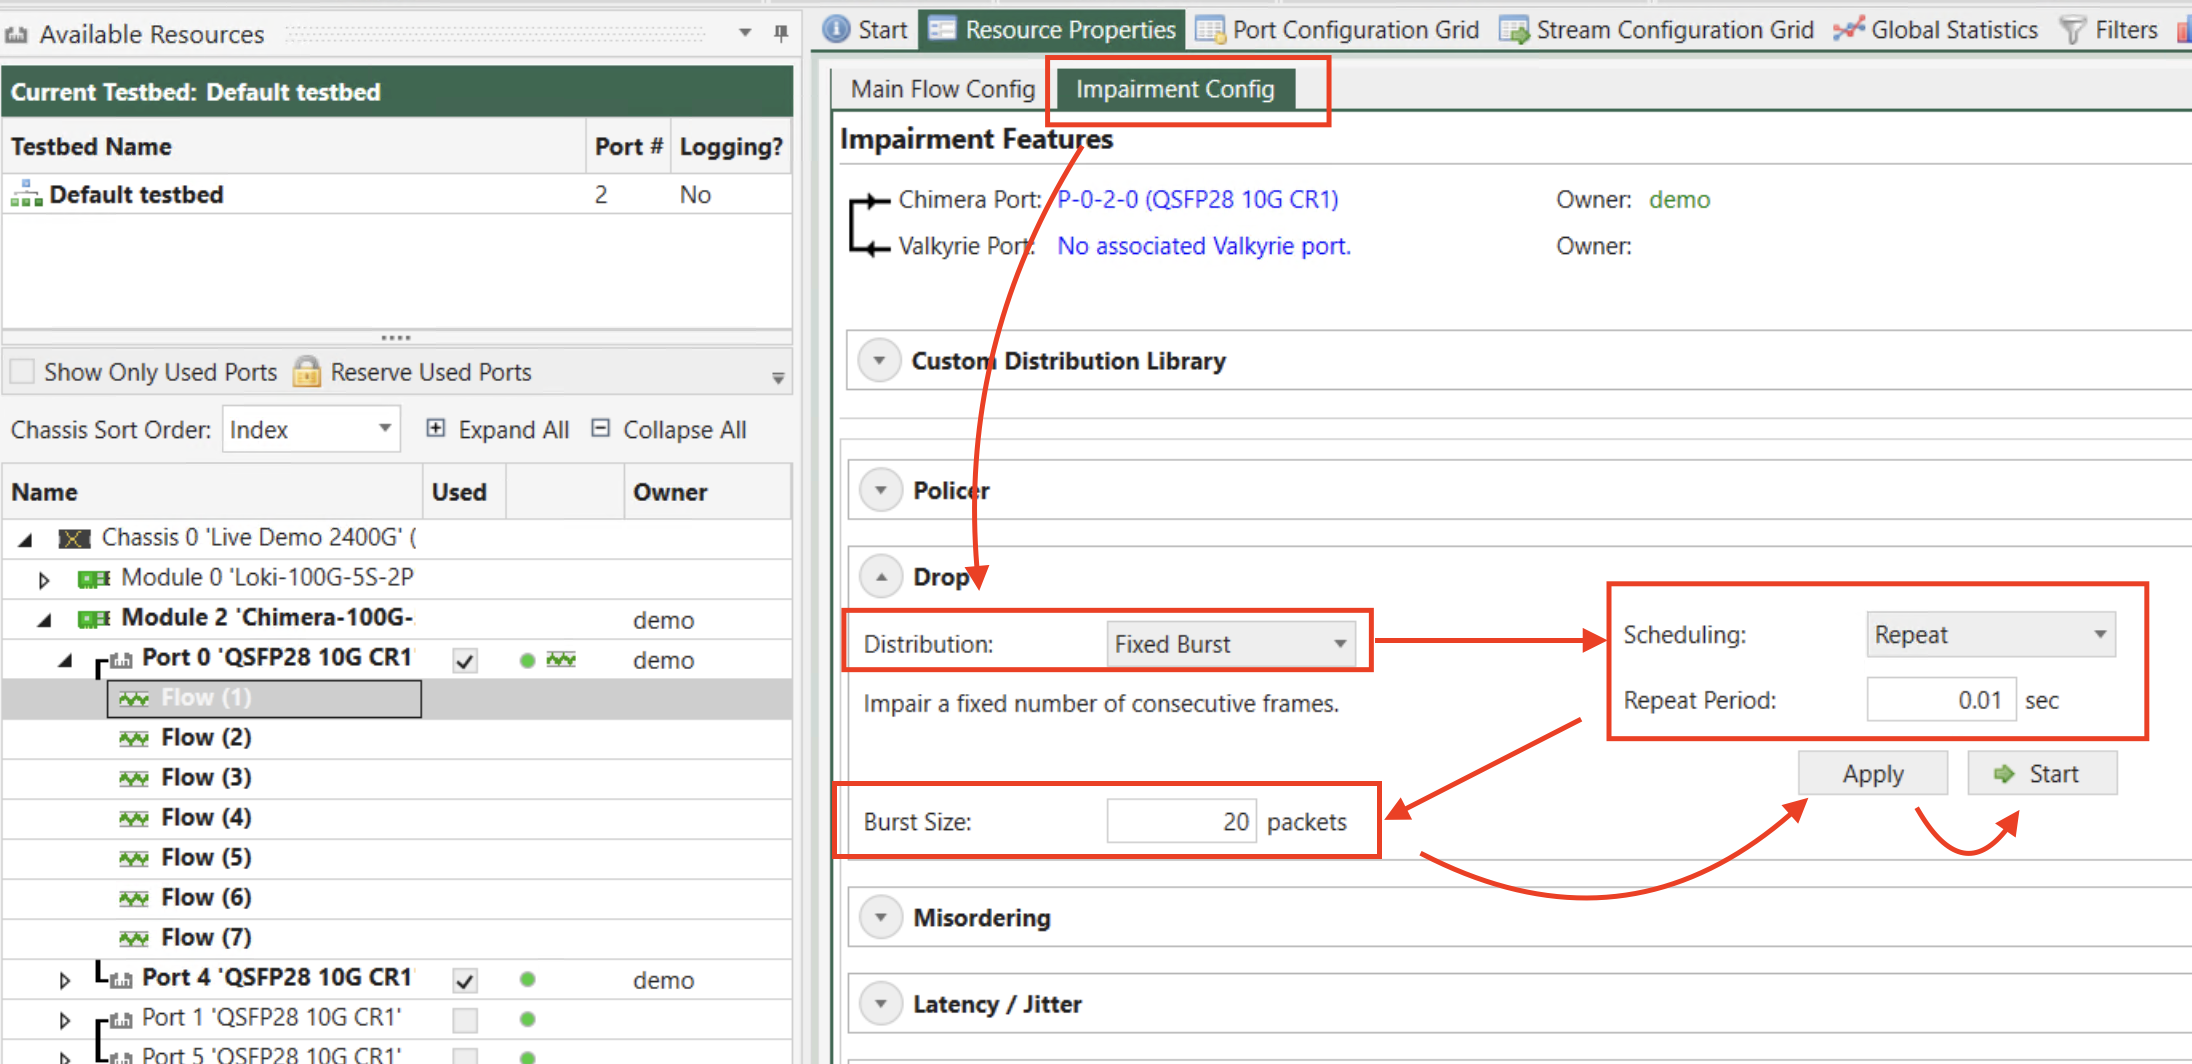
Fig. 3.27 Configure flow impairment
Now you can see the drop function is active. To stop the drop function, simply click Stop.
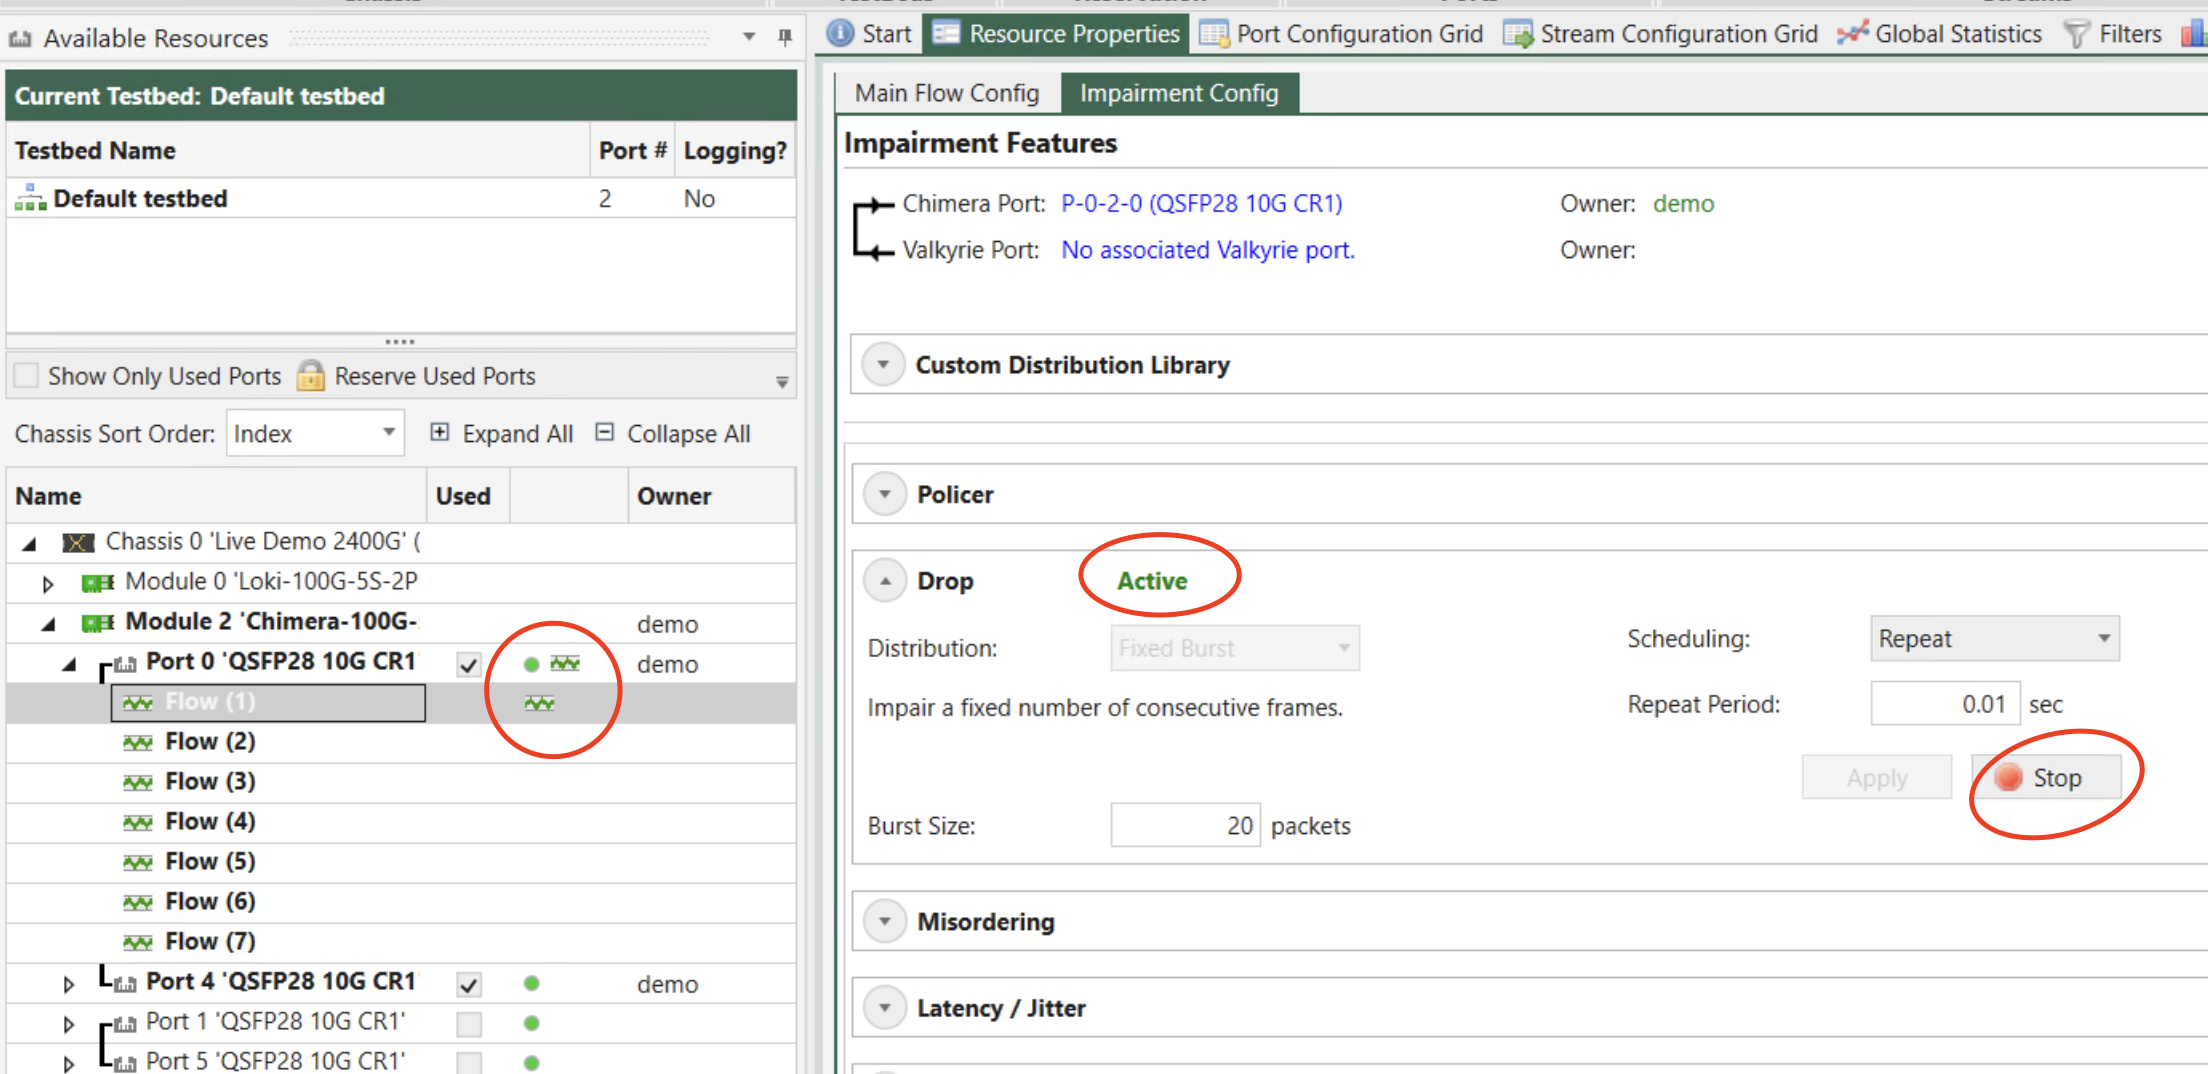
Fig. 3.28 Configure flow impairment
3.2.6. Chimera Statistics
Now let’s go to check the drop statistics.
Go to Global Statistics tab.
Click Chimera Statistics tab.
Under Total Counters, the RX and TX statistics on Flow (1) VLAN 10 show you the traffic statistics captured by the flow filter.
Under Packet Drop, you can see the drop statistics on Flow (1) VLAN 10.
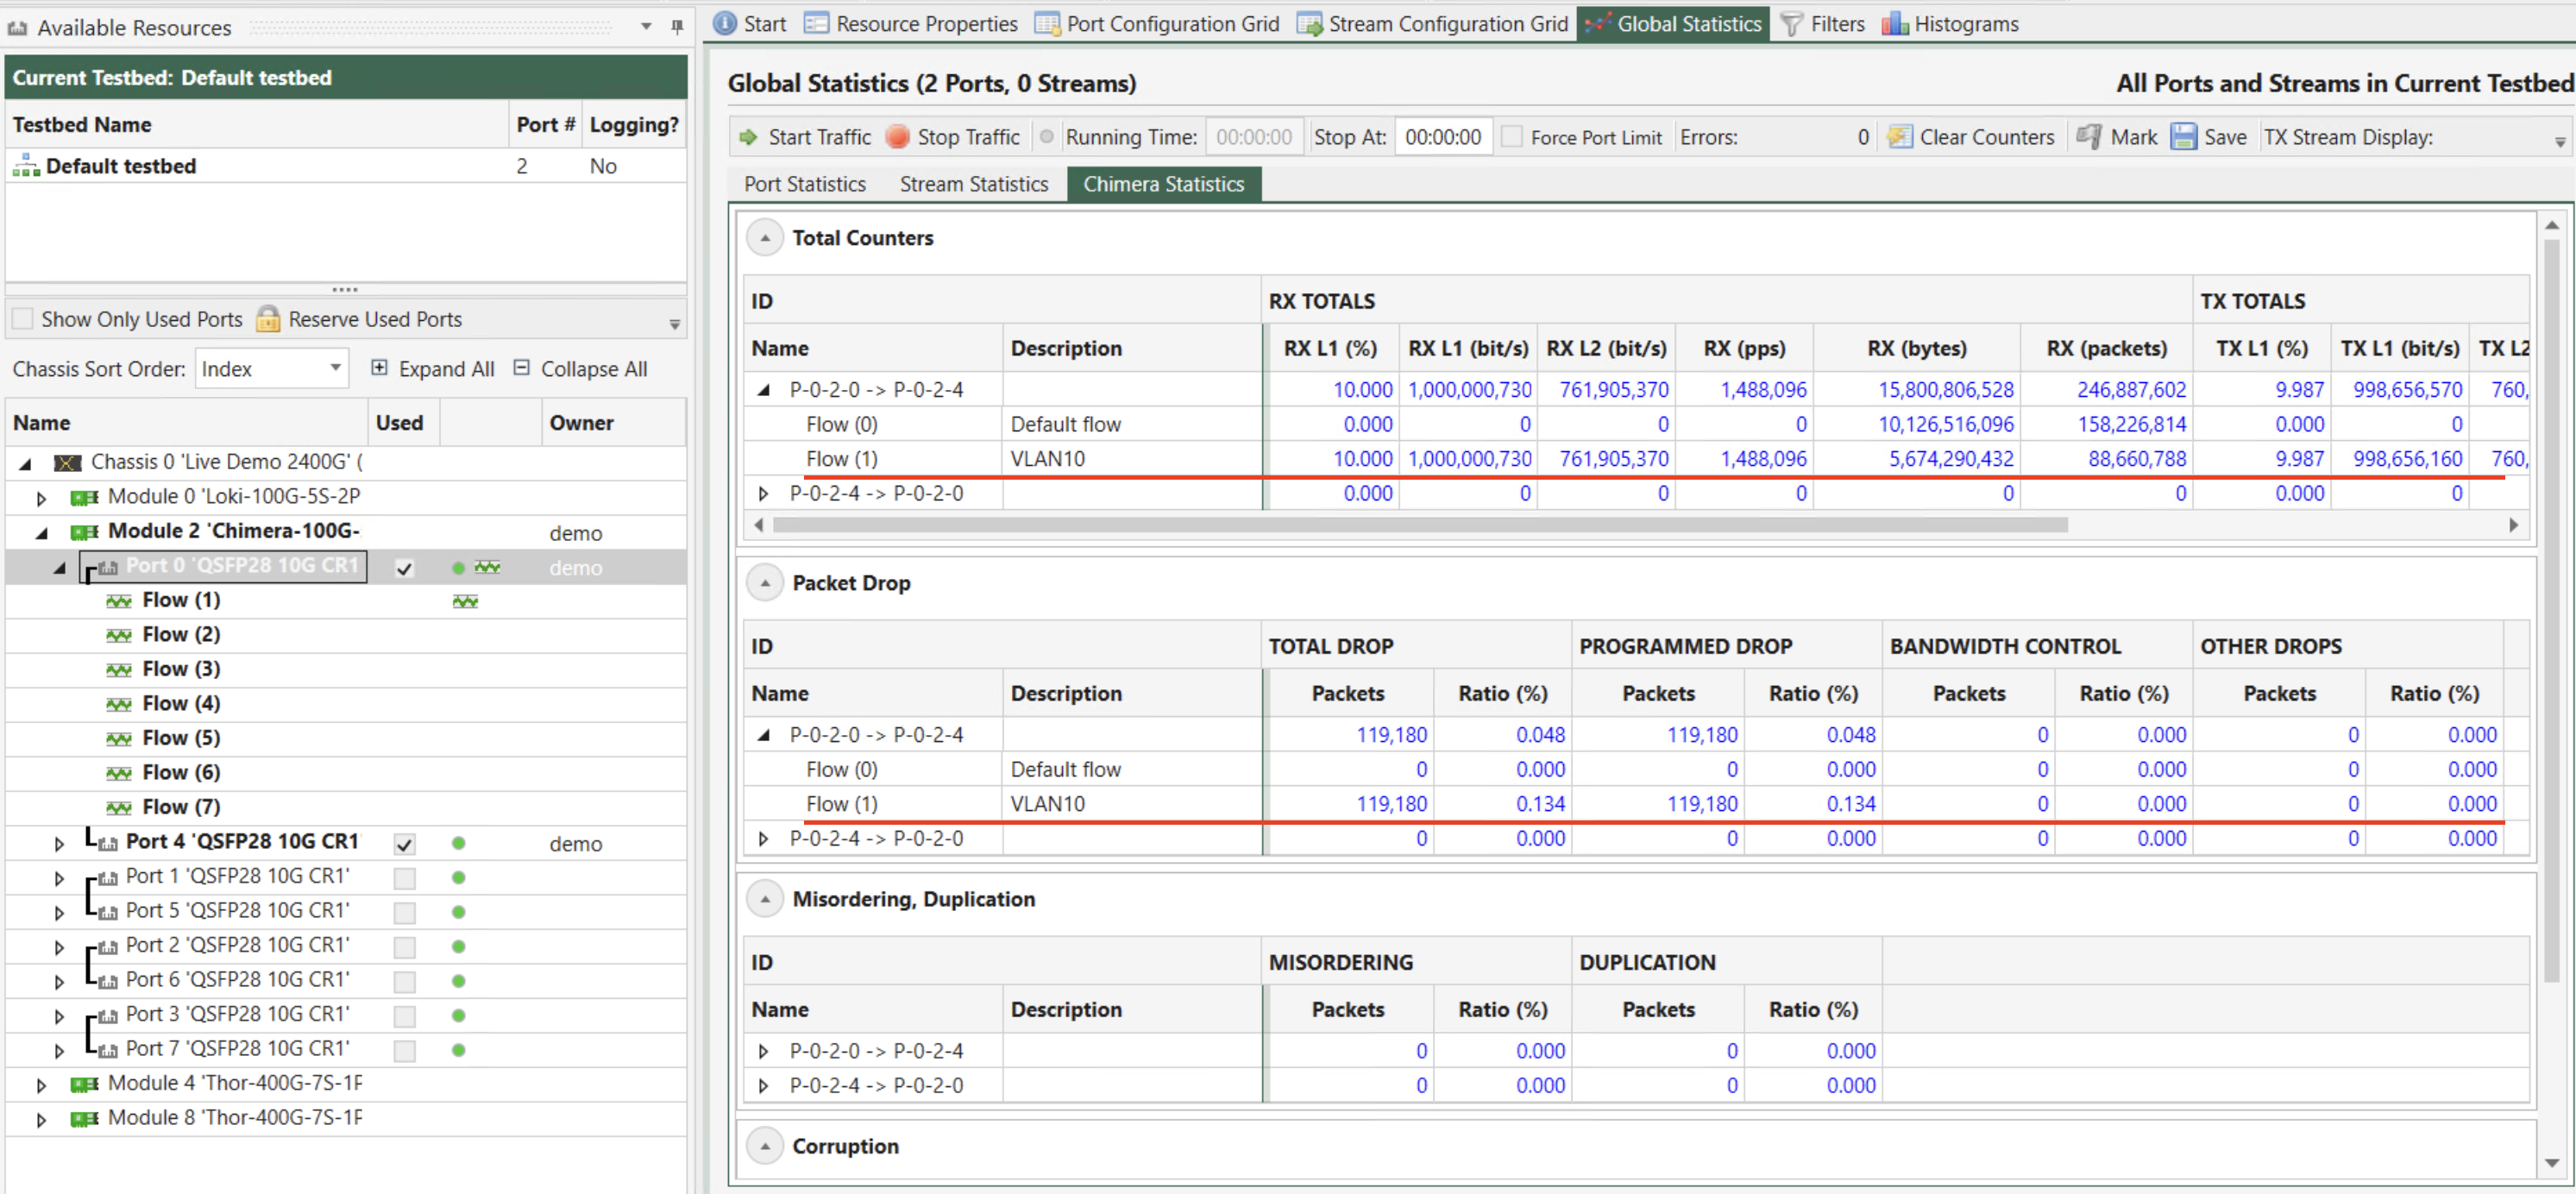
Fig. 3.29 View impairment statistics in Global Statistics