Advanced PHY Features#
This section only applies to ports on high-speed modules (CXP ports excluded). For these ports, an additional sub-tab Advanced PHY Features will appear in the main Resource Properties tab as shown in the image below. The Advanced PHY Features include the ability to control the PHY tuning in the transmit and the receive directions.
Configuration and Controls#
The configuration and controls for the advanced PHY features are shown in the image above. They consist of two main sections: Per SerDes TX PHY Tuning and Overall RX PHY Tuning.
Per SerDes TX PHY Tuning#
This section allows the user to manually control and monitor the equalizer settings of the individual SerDes of the on-board PHY in the transmission direction (towards the transceiver cage). The affected SerDes is selected using the SerDes Index parameter described under Diagram Control. By checking Common Parameters setting will apply to all SerDes of the port. This feature can, for example, be used to improve the signal quality over a directly attached copper cable (e.g. CR4) in the absence of automatic TX tuning auto-negotiation or to test a transceiver using various TX equalization settings.
Property |
Explanation |
|---|---|
TX Pre 1 TX Pre 2 |
Transmit pre-emphasis. Depending on port type one or both of these parameters will be enabled |
TX Main |
Transmit attenuation. |
TX Post 1 TX Post 2 TX Post 3 |
Transmit post-emphasis. Depending on port type one or more of these parameters will be enabled |
Note
The absolute values of the equalizer parameters to be used depends on the port type.
Some modules only have one RX CTLE parameter, where-as some instead have a high band and low band frequency equalizer. Depending on module the available options will be made configurable.
Overall RX PHY Tuning#
This section allows the user to control the tuning of the on-board PHY in the receive direction (signals coming from the transceiver): The user can enable or disable the automatic receive PHY retuning, which is performed on the interfaces as soon as a signal is detected by the transceiver. This is useful if a bad signal causes the PHY to continuously retune or if for some other reason it is preferable to use manual retuning. Regardless of whether the automatic tuning is enabled, the user may also trigger a manual retuning of the PHY. Note that as opposed to the TX tuning, receive tuning affects ALL SerDes on the port.
Property |
Explanation |
|---|---|
Auto-Tune PHY Enabled |
Enable/Disable the automatic RX PHY tuning upon signal detection at the transceiver. |
Retune PHY Now |
Press to trigger a manual RX PHY tuning. |
Eye Diagram#
Some ports support a bit-error-rate (BER) eye diagram. If the eye diagram is supported, a third section Diagram Control is added to the Advanced PHY Features configuration section as shown in Fig. 69.
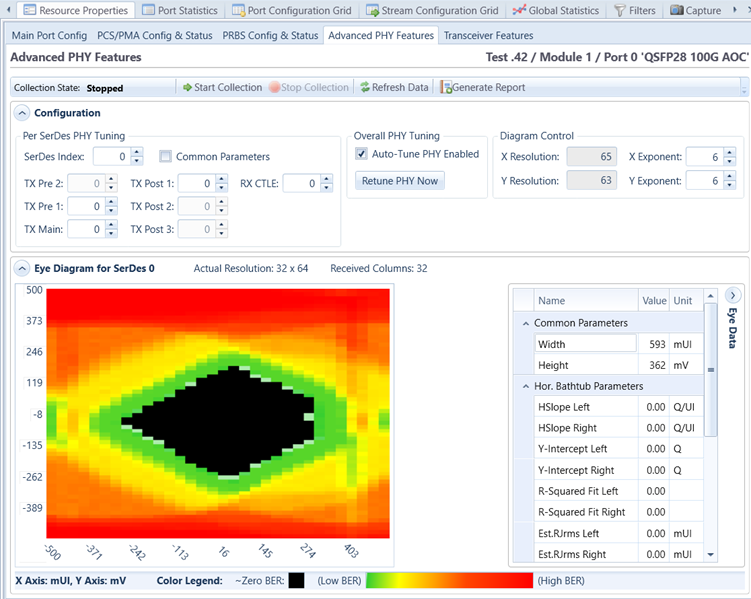
Fig. 69 Eye diagram#
The bit-error-rate (BER) eye diagram allows the user to get a direct visual representation of the signal quality. The eye diagram is formed by changing the sampling point of the PHY step by step in the time dimension (sampling delay) and the amplitude dimension (0/1 threshold). For each sampling point (x,y), 1 million bits are measured and the number of bit-errors is counted. A simple division gives the BER. The result is the BER eye diagram shown above.
The color map shows the measured bit-error-rate for each point going from 1 million (maximum red) to zero (black). The color scale is logarithmic. Higher resolutions give a more clear diagram and higher values of X and Y will also give a higher precision in the vertical and horizontal bathtub curve estimations, respectively (see Eye Data below). However, the time it takes to measure the eye is directly proportional to the number of sampling points (X*Y).
Diagram Control#
This section controls the collection of the BER eye diagram and eye data as well as the parameters associated with this measurement.
Property |
Explanation |
|---|---|
Collection state |
Shows the current state of the eye diagram measurement. |
Start/Stop Collection |
Start/Stop eye diagram measurement. |
Refresh Data |
Re-read current eye diagram and eye data measurement from the chassis. Press this to view the current eye measurement for the SerDes if one already exists. |
Generate Report |
Generates a pdf report of the eye diagram. The report is stored in the following folder: |
X Resolution |
Resolution of the time-axis (horizontal). Calculated from X Exponent as |
Y Resolution |
Resolution of the voltage axis (vertical). Calculated from Y Exponent as |
X Exponent |
User-settable X resolution exponent. Min/Max = 3 / 6. |
Y Exponent |
User-settable Y resolution exponent. Min/Max = 3 / 8. |
SerDes Index |
The SerDes for which the settings and controls listed above, as well as the Per SerDes TX PHY Tuning listed below applies. Valid values = 0..3. |
Note
Note that higher values of X and Y will give you a higher precision in the vertical and horizontal bathtub curve estimations, respectively. However, the time it takes to measure the eye is directly proportional to the number of sampling points (X*Y).