5. General Panels
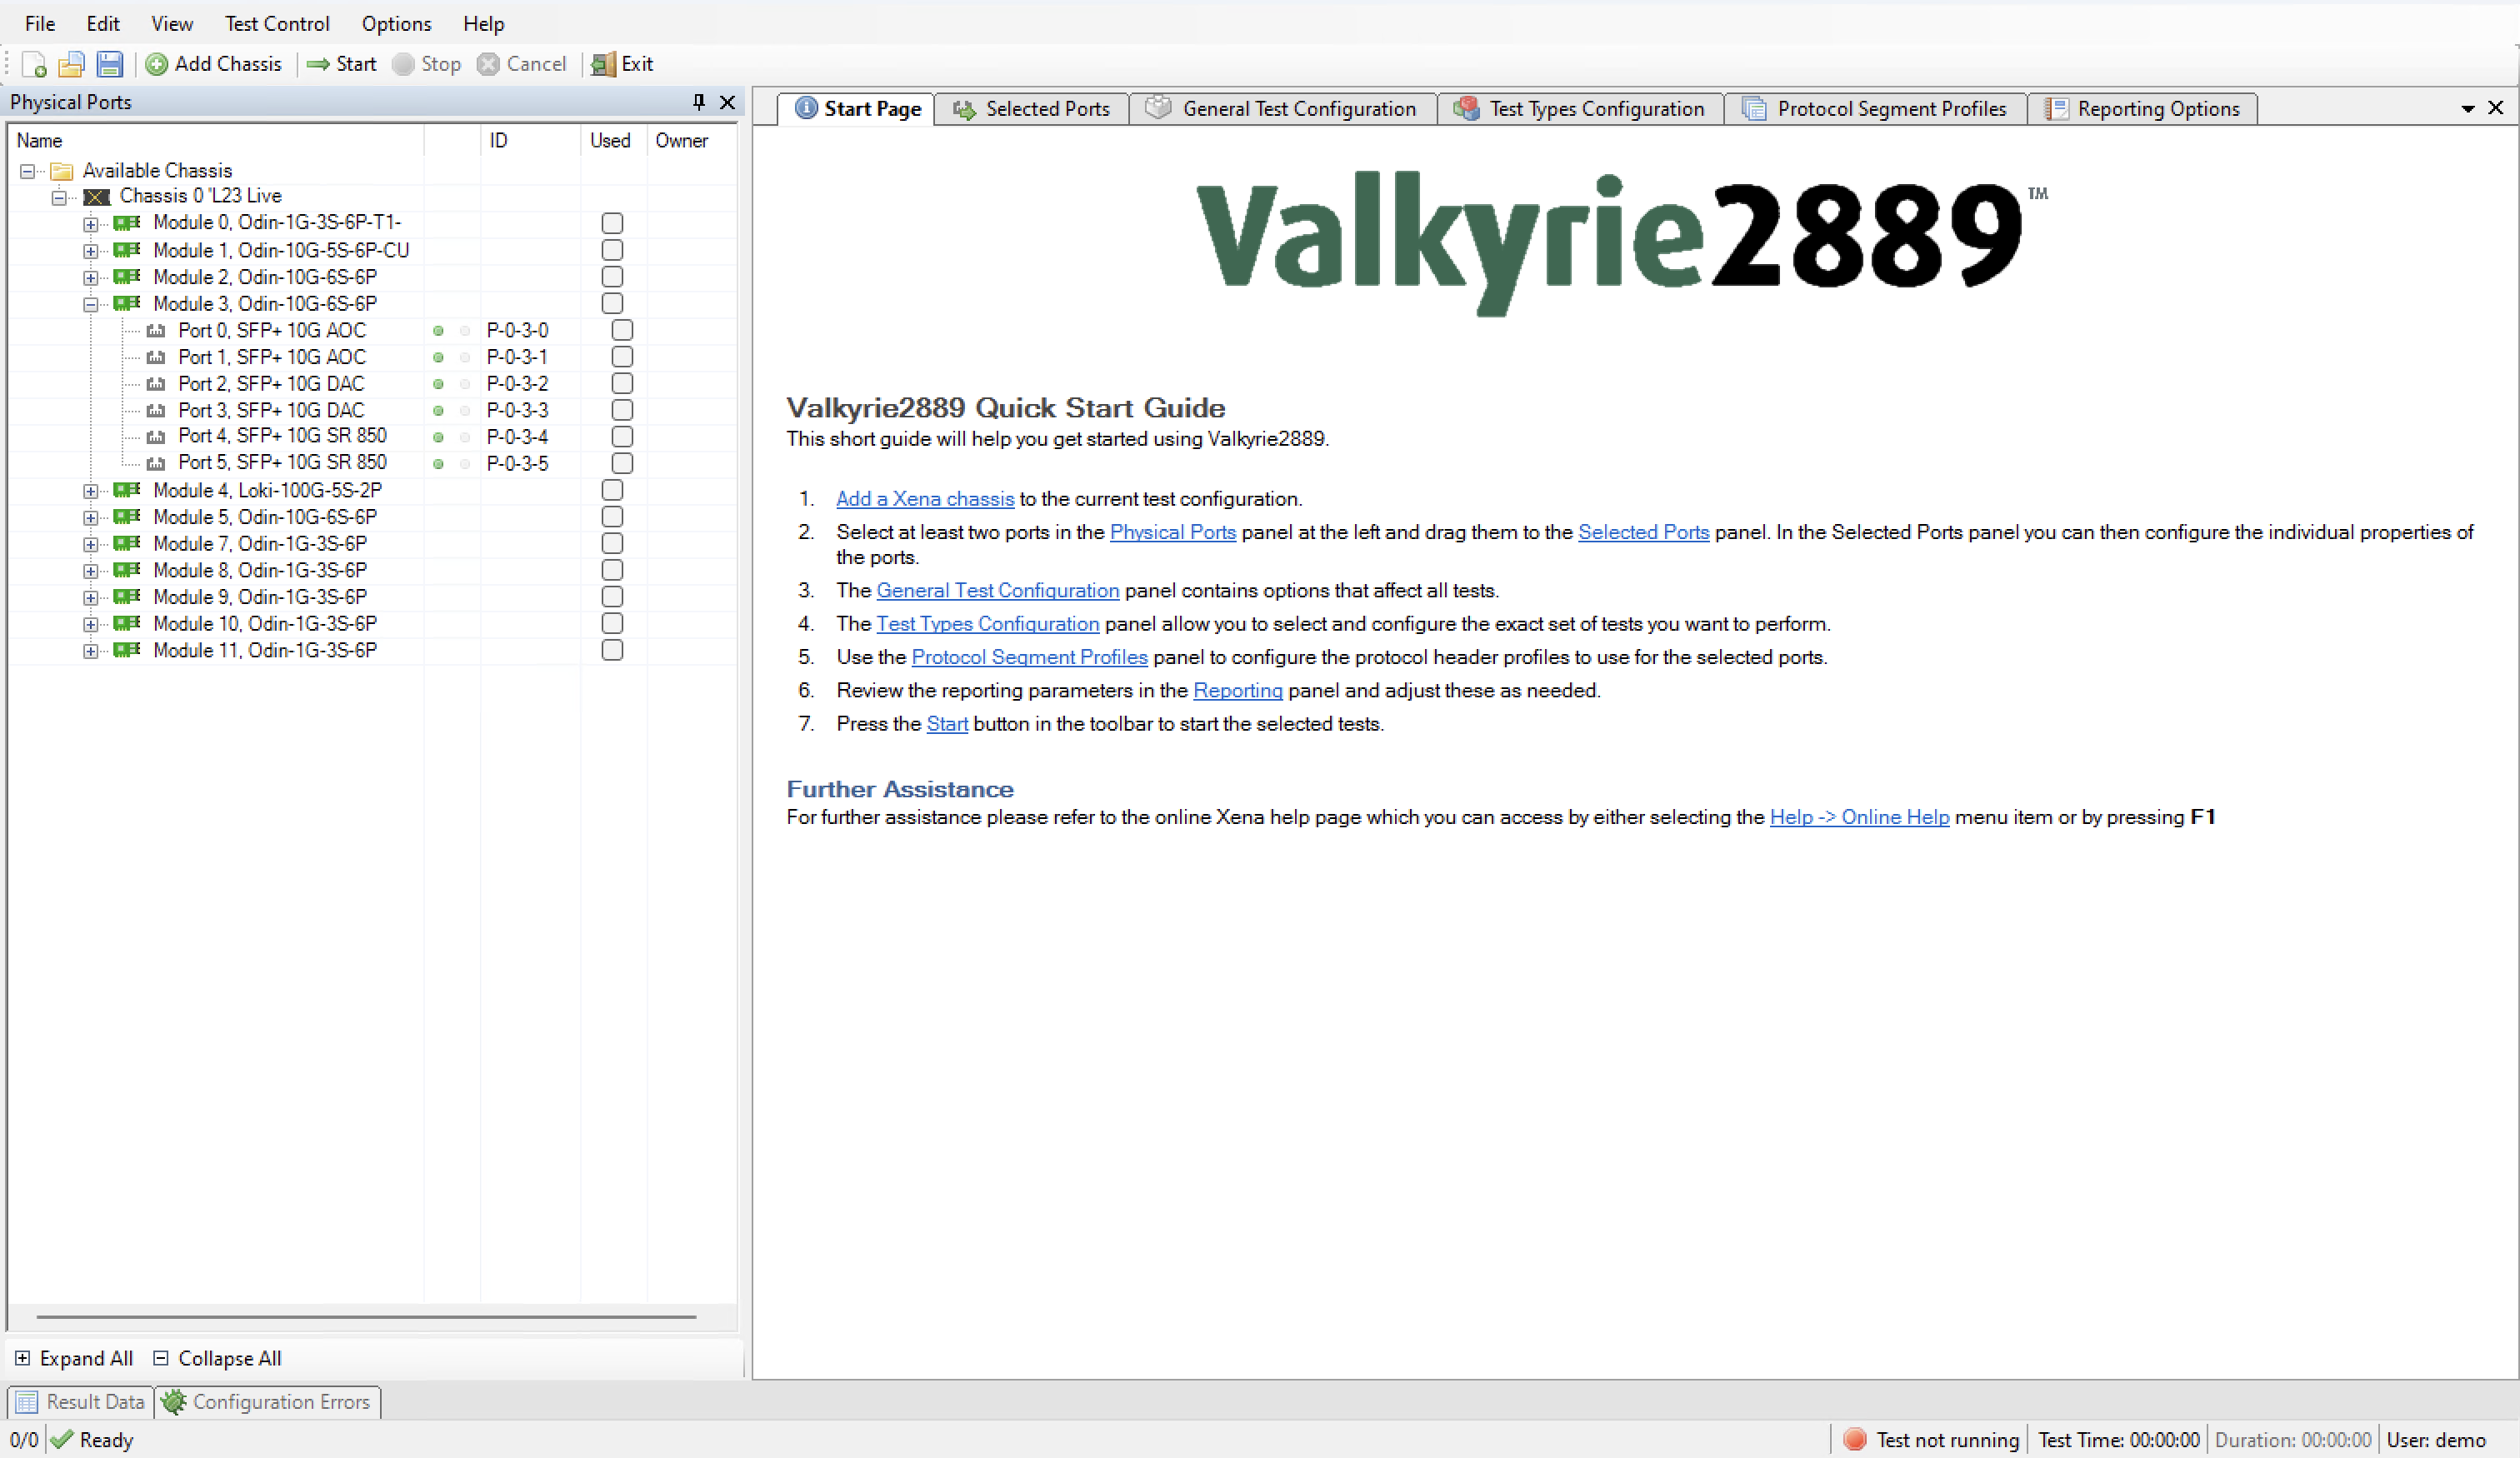
The main Xena2889 application screen is shown in the image below.

Fig. 5.1 Xena2889 application screen
At the top you find a menu bar with accesses various application-level functions. You also find a toolbar with quick shortcuts to the most used functions.
At the left you find a tree view named “Physical Ports” showing the available Xena chassis, modules and ports.
At the right you find a tabbed view with various application panels. These are explained below.
At the bottom you also find a tabbed view containing a few status panels. These are also explained below.
5.1. Application Panels
Start Page
The default main page shown to the user. This page contains a brief guide to assist you in creating an initial test configuration. You can close this panel once you feel that it is no longer useful to you.
Selected Ports
This panel allows you to include Xena test ports in your test and to configure the behavior of these ports. You select the ports in the Physical Ports view and drag them to theSelected Ports panel to include them in the test.
General Test Configuration
This panel control the common aspects of the Test Configuration, such as frame sizes and port rates.
Test Types Configuration
This panel control what tests you are actually going to execute and also handles the test type-specific configuration options.
Protocol Segment Profiles
This panel allow you to create and/or configure profiles for protocol segment headers. Each port can be assigned a different protocol header so that it is possible to give each port a different set of headers.
Reporting Options
This panel control all aspects of the reporting function.
5.2. Status Panel
Result Data
This panel displays the test result data in a grid view. Both the progress counters and the final test data is shown. Progress counters are shown using an italics font whereas the final data is shown with a normal font.
Configuration Errors
This panel displays any configuration errors detected in your configuration when attempting to start a test.